For every neutralisation across 2025 and 2026 to date, we found the last green-flag lap before it began and the first green-flag lap at least two laps after it ended. On each of those laps we took every car's cumulative race time and calculated two things: the leader's gap to second, and the spread from the leader to the last runner.
Two laps after the restart is a deliberate choice. Measuring at the instant of the restart tells you about a queue of cars, not about a race. Two laps later, racing has resumed and the order has settled, and that is the number that actually decides what happens next.
That produced 34 periods: 14 full safety cars and 20 virtual safety cars.
One honest note on sample size. We said in advance we wanted at least 15 full safety car periods and we found 14. We are reporting it anyway rather than quietly moving the line, because the effects here are enormous and consistent rather than marginal. The direction is not in doubt. The precision of the exact percentage is.
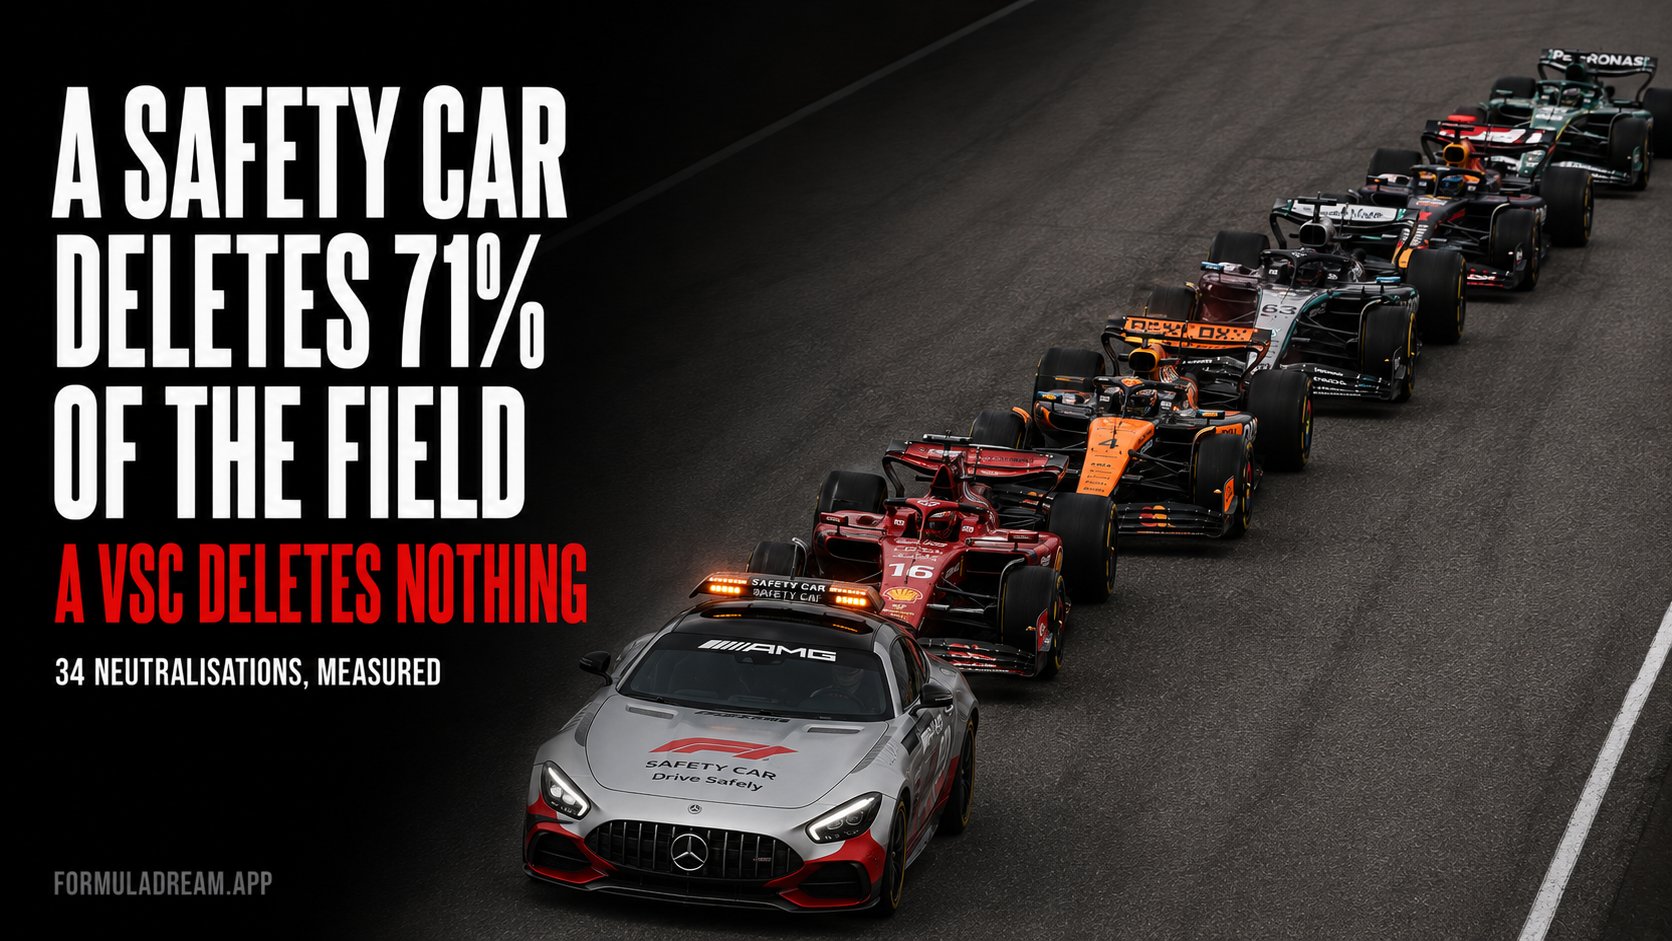
The safety car does most of what people say. The VSC does none of it.
Full safety car: field spread 75.4s before, 22.1s after. 71% removed.
The mechanism explains it completely, and it is worth being precise about, because the two are constantly discussed as though they are the same tool at different strengths.
A full safety car puts a physical car on the track and everybody queues up behind it. The queue has a fixed length regardless of how spread out the race was. A minute of hard-won advantage and five seconds of advantage collapse into the same nose-to-tail train.
A virtual safety car does something completely different. Every driver has to hold a delta, running roughly 35% slower everywhere on the circuit. Because the slowdown is proportional and applies to everyone at once, the running order and the relative gaps are preserved exactly. Nobody catches anybody.
That the VSC number goes slightly up, from 164s to 180s, is not the VSC pushing cars apart. It is the ordinary spreading of a race continuing across the laps in between, entirely unaffected. The VSC leaves the race exactly as it found it, which is precisely what it was designed to do after Jules Bianchi's crash in 2014.
13 of the 14 full safety cars closed the field up. 18 of the 20 VSCs did not. For a measurement with this few periods, that is about as clean a separation as you could ask for.
Field spread before and after each individual full safety car period
The single exception is a short Zandvoort period where the spread grew, which is what happens when a neutralisation is brief and a chunk of the field pits through it.
The bit everyone gets wrong
Search for what a safety car does and you will be told, repeatedly, that every gap built up over the previous laps is wiped out in one go. One widely-shared explanation puts it directly: if the leader had a ten second gap, that gap would vanish, and second place would be right behind them at the restart.
Measured, that is not what happens.
The leader's advantage over second place before and after a neutralisation
The leader's gap to second goes from 2.59s to 1.53s. That is 41% removed, and 59% retained.
Two things explain the difference between the story and the number.
The first is that the story describes the instant of the restart, and we are measuring two laps later. By then the leader, who controls the pace at the restart and gets the run on everybody, has already begun rebuilding.
The second is that the gap to second was rarely ten seconds to begin with. The median gap between first and second before a safety car is 2.59 seconds. The dramatic version of this story imagines a leader cruising half a minute clear, and that is not the typical race.
So the honest summary: a safety car is brutal for a leader's advantage over the field, wiping 71% of it, and considerably less brutal for their advantage over the car directly behind them, wiping 41%.
Why this matters for pit strategy
This connects directly to something we measured separately. A pit stop under a full safety car costs 14.24 seconds against 21.88 seconds under green, a saving of 35%. Under a VSC it costs 18.13 seconds, a saving of only 17%.
Now the reason is visible. A pit stop is cheap under neutralisation because your rivals are moving slowly while you are in the pit lane. Under a full safety car they are crawling behind a road car and bunching up, so you lose very little ground. Under a VSC they are slower but still spread out and still covering ground in the same relative order, so you lose much more of what you would have lost anyway.
The VSC saves you half of what a safety car saves you, because it does half as much to the people you are racing. Or more precisely, it does none of the bunching and only some of the slowing.
What this changes about watching a race
A safety car is not a reset button for the leader. They keep nearly 60% of their gap to second. What they lose is their cushion over everybody else.
A VSC changes nothing about the order. If a team gambles on a VSC stop and it does not work out, it is not because the VSC closed the field up. It did not.
The moment a full safety car is called, everyone behind is suddenly in play. 75 seconds of spread becomes 22. Drivers who were a lap from being lapped are now racing the cars around them again.
Watch for the difference in the commentary. The two get used interchangeably and they are not remotely the same event.
Method
Data: FastF1, the 2025 season and the 2026 races completed at the time of writing.
A period is a run of consecutive laps whose track status includes safety car (status 4) or virtual safety car (status 6 or 7).
"Before" is the last full green lap preceding the period. "After" is the first full green lap at least two laps after it ends.
Gaps are real time gaps computed from cumulative end-of-lap session times on a common lap, not position numbers.
Periods where fewer than 8 cars have a usable time on either the before or after lap are dropped, which removes end-of-race neutralisations and red flag situations.
Sample: 14 full safety car periods and 20 VSC periods. We declared 15 SC periods as the minimum in advance and fell one short. Reported as found. The 71% versus 0% separation is far larger than that shortfall can account for, but the exact figures should be read as approximate.
The pit stop cost figures quoted (21.88s green, 18.13s VSC, 14.24s safety car) come from our own separate measurement of the same seasons.
A safety car deletes most of the field spread within a lap, and you can watch it happen.
The Formula Dream app collects every FIA document of the weekend as it is released, which is where the decision behind a penalty actually appears, usually before the commentary catches up. It also runs a live Dashboard through every session with all the cars on the circuit map, a timing tower carrying lap times, gaps, intervals, tyre compound and age, flag and safety car alerts the moment race control calls them, and live driver radio as it is broadcast.
Free, no subscription, no ads, independent. Not affiliated with Formula 1.