F1 Track Domination: which driver owned each part of the lap, rendered in 3D, by Formula Dream
Melbourne 2026 Qualifying: who was fastest through each minisector
Comparing Russell, Antonelli, Hadjar at Melbourne 2026 qualifying, Russell was fastest through 50.5% of the lap. Stitching every minisector's fastest driver together gives a best possible lap of 1:17.886, a lap nobody actually drove. Shares are measured across 600 racing-line samples.
| Driver | Share of lap fastest |
|---|---|
| Russell | 50.5% |
| Antonelli | 31.5% |
| Hadjar | 18.0% |
This compares the selected drivers only, not the full grid.

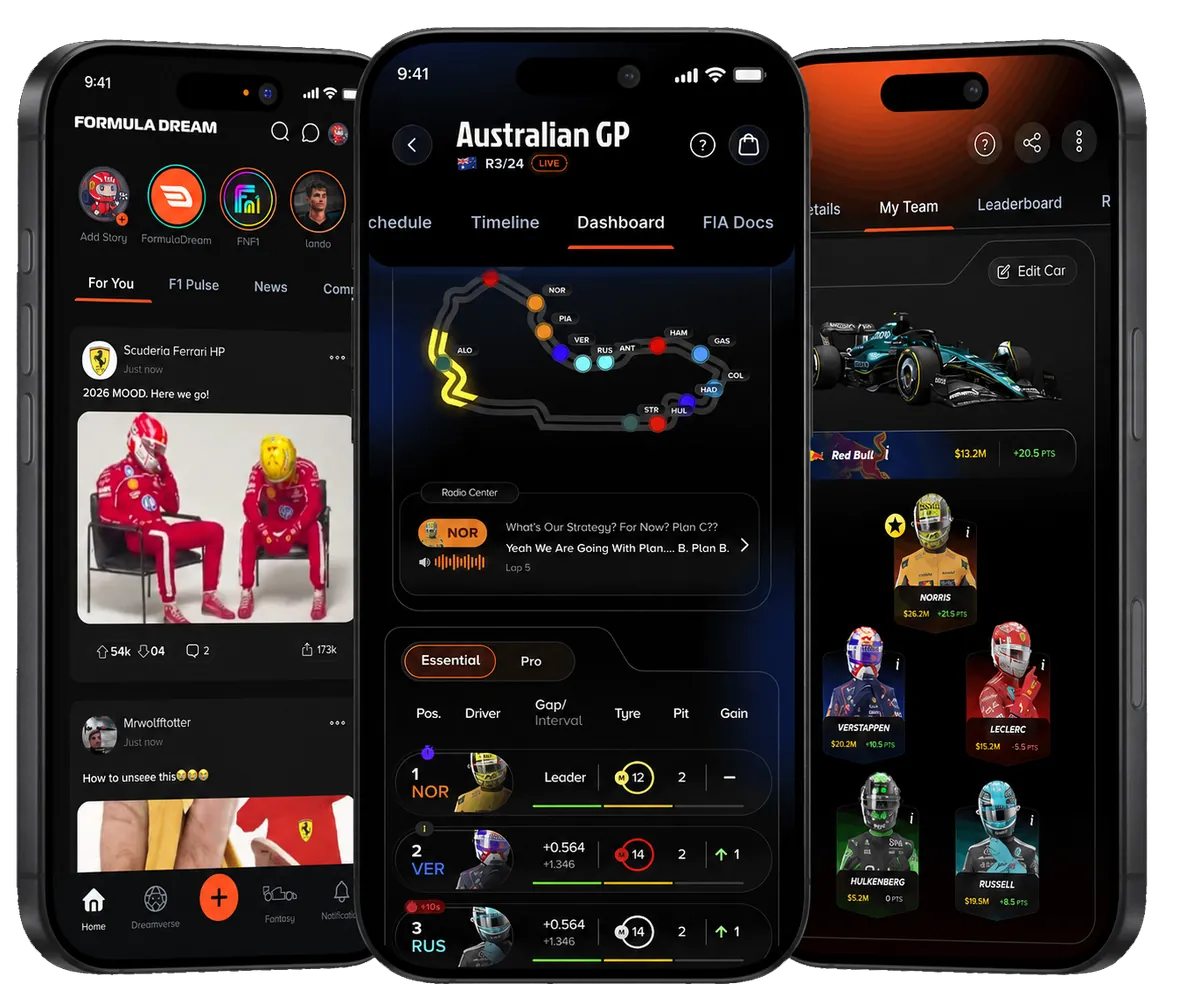
Track Domination
Who owned each part of the lap.
A laptime is one number that hides dozens of small battles. Track Domination splits a qualifying lap into minisectors, short segments a few hundred metres each, and colours the racing line by whoever was fastest through every segment. Instead of a single time, you get a map of who owned which part of the lap.
What is a minisector?
A minisector is a short stretch of track, defined by distance rather than by time, that a lap is broken into so drivers can be compared piece by piece. Splitting by distance matters: it means segment three is the same piece of tarmac for everyone, so "who was fastest through segment three" is a fair question.
How it works
- Pick a session and drivers. Choose a qualifying session and two or three drivers.
- Each minisector is timed per driver. The lap is split into segments and the time each driver took through each one is compared.
- The line is coloured by the winner. Every segment takes the colour of whoever was quickest through it. Where one colour dominates, that driver was building the lap; where it flickers, the field was trading tenths corner by corner.
The lap nobody drove
Take the fastest minisector from anyone across the whole session and stitch them together and you get a theoretical best lap: the time that was physically on the table if one driver had strung every segment's best together. It is always quicker than the actual pole, sometimes by more than a second, and it is a clean measure of how much time was left out on the track.
Why it is useful
Two drivers can set nearly identical laptimes in completely different ways, and the minisector map shows how. It is the difference between "he was 0.1s quicker" and "he was quicker everywhere except the last corner." It also shows a car's character: a team strong in fast corners lights up the quick sections; one with better traction owns the slow-corner exits.
Frequently asked questions
What is minisector analysis in F1?
It is splitting a lap into short segments and comparing who was fastest through each one, so you can see where on the track a laptime was actually won or lost, rather than just the final time.
What does a colour on the track mean?
Each colour is the driver who was fastest through that segment of the lap. It means fastest there specifically, not fastest overall, a lap can be a patchwork of colours and still belong, on total time, to a driver who barely shows up on it.
What is a theoretical best lap?
The lap you get by combining the fastest minisector from any driver in the session. It shows the maximum that was on the table and how much time the real pole lap left behind.
How is domination calculated?
Each driver’s fastest lap is sampled along the racing line and the circuit is divided into small distance slices. For every slice, the tool compares who carried the most speed through it; that driver owns the minisector.
Which sessions can I load?
Any qualifying session in the archive, with two or three drivers compared at a time.
Is the data real?
Yes. It is built from official Formula 1 live-timing telemetry, the same positional data behind the world feed graphics.
Keep exploring
Formula Dream is unofficial and not associated with the Formula 1 companies. F1, FORMULA ONE, FORMULA 1, FIA FORMULA ONE WORLD CHAMPIONSHIP, GRAND PRIX and related marks are trade marks of Formula One Licensing B.V.