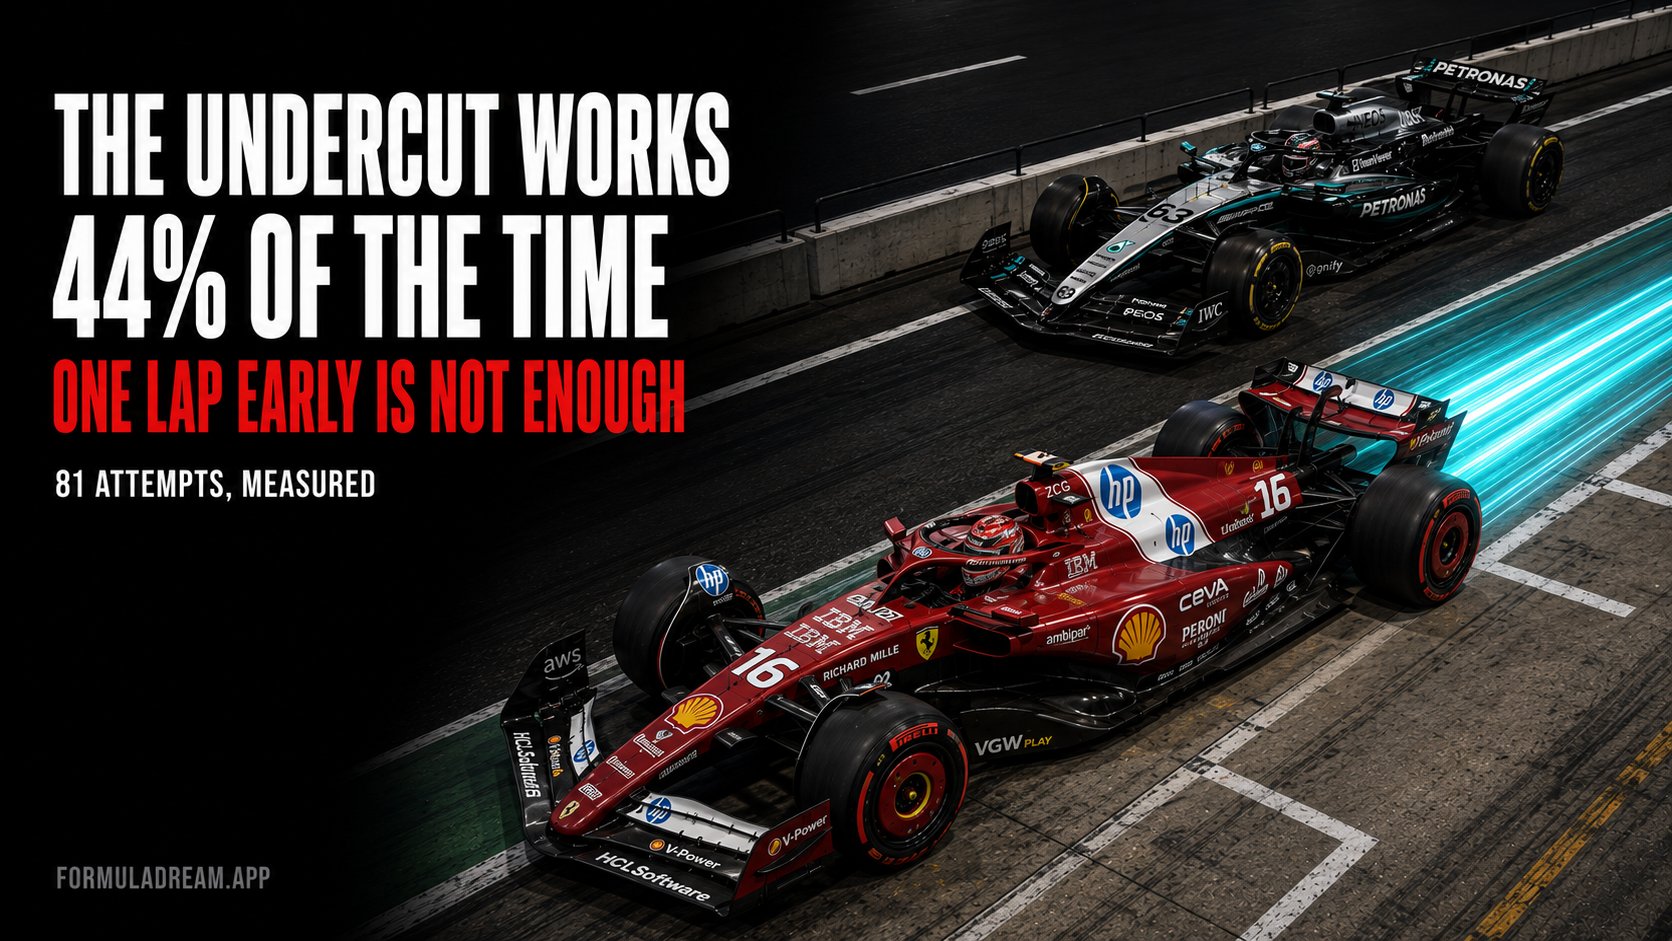
The trailing driver pits first. On fresh tyres they run several seconds a lap quicker than the rival still circulating on worn rubber. If they gain enough time in those laps, they emerge ahead once the rival finally stops.
It is the most common strategic move in Formula 1 and one of the least measured. Search for how often it works and you will find the term defined, the mechanism described, and almost no numbers. One analysis of 766 attempts exists, but its rates sit behind a paywall. Nothing free tells you the success rate.
So we counted.
How we measured it
For every pit stop in the 2025 season we asked:
Who was directly ahead of this driver on the previous lap?
Were they within three seconds, close enough for it to be a live attempt rather than an unrelated stop?
Did that rival then pit within the next five laps, so both have stopped and the comparison is fair?
Two laps after the rival's stop, who is ahead?
If the challenger is now in front, the undercut worked. That produced 81 genuine attempts across the season.
Three checks were set before running it. At least sixty attempts, or the sample is too thin. A success rate between 15% and 85%, because zero or one hundred would mean the method is broken. And meaningful variation between circuits, because if every venue returned the same number we would be measuring noise rather than strategy. All three passed.
One lap is not enough
This is the finding with the most practical value, and it is stark.
One lap earlier: 34% success (17 of 50)
Two laps earlier: 69% success (9 of 13)
Three laps earlier: 60% (3 of 5)
Four laps earlier: 54% (7 of 13)
Pitting a single lap before your rival is worse than a coin toss, and it is by far the most common choice, accounting for fifty of the eighty-one attempts.
The reason is arithmetic. A pit stop costs about 21.88 seconds, which we measured separately across every stop of the season. Fresh tyres are worth roughly a second a lap over worn ones, sometimes less. One lap of advantage does not buy back enough. Two laps roughly doubles the gain while the cost stays the same.
The tail-off after two laps is real but modest, and it has an obvious cause: stop too early and your own tyres are worn out before the stint ends, so you surrender at the other end what you gained at the start.
Montreal: twelve attempts, zero successes
Circuit variation is enormous.
Undercut success by circuit, 2025 races, circuits with at least four attempts
Barcelona: 100% (4 of 4)
Imola: 83% (5 of 6)
Silverstone: 67% (4 of 6)
Bahrain: 55% (6 of 11)
Shanghai: 50% (3 of 6)
Zandvoort: 50% (2 of 4)
Interlagos: 50% (2 of 4)
Suzuka: 20% (1 of 5)
Montreal: 0% (0 of 12)
Twelve attempts at Montreal. Not one worked.
Sample sizes per circuit run from four to twelve, so no single circuit figure should be taken as precise. The spread between them, however, is far too large to be chance, and Montreal's zero from twelve is the largest sample of the lot.
The undercut needs degradation, not a short pit lane
This is the part worth dwelling on, because the intuitive explanation turns out to be wrong.
You would expect the undercut to work best where pit stops are cheap. Montreal has one of the cheapest pit lanes on the calendar at 19.44 seconds, and went zero from twelve. Imola has the most expensive at 27.52 seconds, and succeeded 83% of the time.
That is not a cherry-picked pair. We have measured pit loss and tyre degradation at every circuit of the same season, so we can line all three numbers up and test both explanations properly. Eight circuits have at least four undercut attempts and both metrics measured.
Undercut success rate tested against pit stop cost and against tyre degradation
Pit stop cost against undercut success: rank correlation +0.29. Weak, and pointing the wrong way. If anything, expensive pit lanes see slightly more undercut success, which is the opposite of the intuition.
Tyre degradation against undercut success: rank correlation +0.74. Strong.
The mechanism is obvious once stated. The undercut is powered by the gap between fresh tyres and worn ones. Where tyres barely degrade, that gap is small, and no amount of clever timing creates an advantage that does not exist. A short pit lane does not help you if the fresh set you have just fitted is not meaningfully faster than the set your rival is still on.
Look at the two ends. Barcelona and Bahrain sit at the high-degradation end and return 100% and 55%. Suzuka, where our measurements found degradation slightly negative across the race as the track rubbered in, returns 20%. Montreal, low degradation, returns zero.
Eight circuits is not a large sample and we are not going to pretend otherwise. A rank correlation of +0.74 on eight points is suggestive, not settled. But it matches the mechanism exactly, and it explains the Montreal result that pit-loss reasoning cannot.
What this changes about watching a race
When a team pits one lap before a rival, the odds are against them. Roughly one in three. It usually means they were forced into it by tyre life rather than choosing a moment.
Two laps is the sweet spot. If a team has the track position and tyre life to wait, and pits two laps early instead of one, they roughly double their chances.
Check the circuit before believing an undercut is coming. At Montreal in 2025 it never once worked across twelve attempts. At Barcelona every attempt did.
A short pit lane is not the thing to look at. Tyre degradation is. If the tyres are not falling away, the undercut has nothing to work with, however cheap the stop.
Low degradation kills the undercut, and that matters for 2026. Our measurements found the compound hierarchy has collapsed this season, with soft, medium and hard degrading at almost the same rate. If that holds, the undercut gets weaker everywhere. It is the clearest thing to watch for in strategy this year.
Method
Data: FastF1, every race of the 2025 season.
An attempt requires: the challenger directly behind the target on the lap before stopping, within 3.0 seconds, and the target pitting within five laps afterwards.
Outcome judged two laps after the target's stop, to allow both out-laps to settle.
81 attempts, 36 successful.
Pit loss and tyre degradation figures come from our own separate measurements of the same season, so all three numbers are on the same basis.
Per-circuit samples are small (4 to 12 attempts). Individual circuit rates are indicative. The season rate and the timing breakdown rest on larger samples and are firmer.
The two hypothesis tests use the eight circuits with at least four attempts and both metrics measured, and report Spearman rank correlation: pit loss +0.29, degradation +0.74. Eight points is suggestive, not conclusive, and the article says so.
Silverstone appears in the circuit ranking but not the correlation test. It was a wet race, so its pit loss and degradation figures were filtered out by the earlier analyses and no honest value exists to plot.
An undercut is obvious afterwards and hard to catch live, unless you are watching tyre age.
The Formula Dream app runs a live Dashboard through every session: every car moving on the circuit map, and a timing tower with lap times, gaps and intervals, tyre compound and age, pit counts and positions gained or lost. It is the same information these measurements come from, arriving live. You also get live driver radio as it is broadcast, and every FIA document of the weekend as it is published.
Free, no subscription, no ads, independent. Not affiliated with Formula 1.