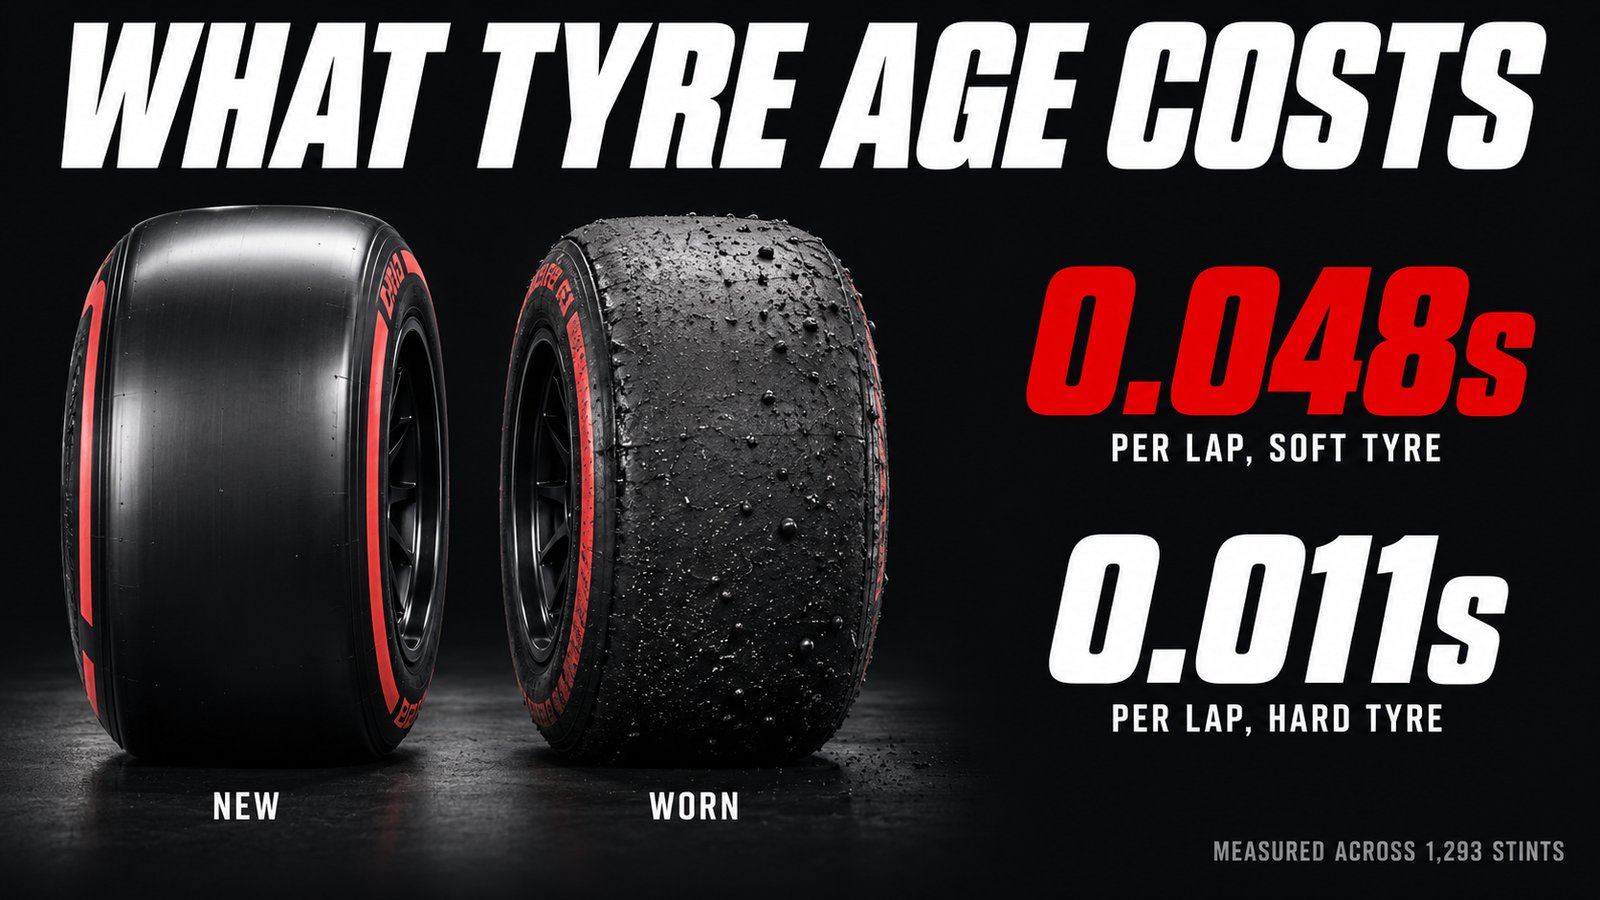
Measured across 854 race stints in 2025, the soft tyre lost 0.048 seconds per lap of tyre age, the medium 0.027, and the hard 0.011. The soft degraded 4.4 times faster than the hard.
Degradation is negotiated on the radio, lap by lap, between a driver who wants to push and an engineer who does not. Our Spanish Grand Prix 2026 race radio archive has the whole conversation.
Measured the same way across 439 stints in 2026, those numbers are 0.045, 0.037 and 0.039. The hierarchy has collapsed.
That is the finding, and it changes what a tyre choice means.
What is tyre age in F1?
Tyre age is the number of laps a set of tyres has completed.
It is the field you see beside the compound on a timing screen, written as the compound letter and a lap count, and it is the single most useful number on the screen once you know what to do with it. A used set carries the laps it ran in earlier sessions, so tyres saved from qualifying already show a lap count before the race starts. Where to find it, and what else is worth watching, is in
It matters because a tyre does not fail suddenly, it fades. A driver on a 20-lap-old soft is losing time to a driver on a 4-lap-old soft every single lap, whatever the gap says. That is what makes an undercut work, and it is why a car that looks like it is holding position is often already beaten. The strategy that sits on top of it is in F1 race strategy explained, and the compounds themselves in F1 tyre compounds explained.
The rest of this piece is what that costs, measured across 1,293 stints rather than asserted.
What degradation actually measures
Not wear. Not how a tyre looks afterwards. Degradation is how much slower a lap gets for each additional lap on the same set of tyres.
If a tyre degrades at 0.05 seconds per lap, then twenty laps into a stint the car is a full second a lap slower than it was on lap one, on the same tyres, driven the same way.
That number is the entire basis of race strategy. It decides when to pit, whether an undercut works, and whether a one-stop beats a two-stop.
How we measured it
This is the part most published figures skip, and it is where the analysis nearly went wrong.
The problem: fuel. A Formula 1 car gets roughly 0.03 seconds a lap faster as fuel burns off. Over a stint that effect is larger than tyre degradation itself. Plot raw lap time against tyre age and you get a result saying tyres get faster as they age, which is nonsense. That is what our first attempt produced.
The second attempt tried to separate the two effects statistically, by fitting tyre age and lap number together. It failed a check we set in advance: the fuel coefficient should have come out near 0.03s and came out at 0.0045s. Within a stint, tyre age and lap number move together almost perfectly, so the model could not tell them apart.
What actually worked: stop trying to estimate the fuel effect and subtract it as a known constant, then fit degradation against tyre age within each individual driver stint. One driver, one set of tyres, one slope.
On top of that: green-flag laps only, no in-laps or out-laps, no inaccurate laps, wet races excluded entirely, a minimum stint length so there is a real spread of tyre ages, and the slowest 10% of laps in each stint dropped to remove traffic and mistakes.
We set two checks before running it. Every compound must degrade positively, and soft must degrade faster than medium, which must degrade faster than hard. The 2025 data passed both.
Raw lap time against tyre age returns nonsense. Fuel-corrected and fitted within stints returns a real answer.
The difference is not subtle. Untreated, the medium and hard both appear to get faster as they age. That is fuel burn-off wearing the disguise of a tyre result.
The 2025 numbers
Soft: Degradation 0.0478s per lap, Stints 127
Medium: Degradation 0.0274s per lap, Stints 391
Hard: Degradation 0.0108s per lap, Stints 336
Put into a stint, that means:
After 20 laps, the soft is roughly 0.96 seconds a lap slower than it started. The medium is about 0.55 seconds slower. The hard is about 0.22 seconds slower.
What a stint costs: seconds lost per lap against laps on the same set of tyres
That is the classic trade every strategist works with. The soft starts quicker and falls away. The hard starts slower and holds.
The 2026 numbers, and why we nearly did not publish them
We ran the identical analysis on 2026.
Soft: Degradation 0.0454s per lap, Stints 50
Medium: Degradation 0.0374s per lap, Stints 177
Hard: Degradation 0.0394s per lap, Stints 212
The ordering check failed. Hard degrades faster than medium. The three compounds sit within 0.008 seconds of each other.
A failed check normally means the method is broken. Here it cannot, because the same code, with the same filters, passed both checks on 2025. If the analysis were flawed it would have failed on both seasons. It did not.
So the conclusion is that the check's assumption is what broke, not the method. The compound hierarchy that held for years is not holding in 2026.
This is not just our result. F1 Chronicle's independent analysis of 2026 reports the same collapse, with the compounds separated by around 0.008 seconds per lap of tyre age, which they describe as the most closely matched range of the ground-effect era. Their exact ordering differs slightly from ours, which is what you would expect when three numbers sit that close together: at that spacing, the ordering is within noise. The compression is the finding. The order is not.
Degradation in seconds lost per lap of tyre age, measured across 1,293 race stints
What a collapsed hierarchy does to racing
If all three compounds degrade at roughly the same rate, the strategic trade that has governed F1 for a decade weakens.
One-stop races become more attractive, because staying out is punished less.
Compound choice matters less than it did. When the differences are within noise, the decision moves towards outright pace and track position rather than managing a degradation curve.
And strategies converge. Teams facing the same shallow curves reach the same conclusions, which tends to produce processional racing rather than the split strategies that create overtaking. Our count of every on-track pass of the season found exactly that at Lusail, where a mandated stint limit forced one strategy on everybody and the race produced four overtakes.
Whether that is good for the sport is a separate argument. What the data says is that the lever teams used to pull is currently shorter.
The circuits that punish tyres most
From the 2025 data, the highest median degradation across compounds:
Bahrain, 0.077s per lap
São Paulo, 0.069s
Spain, 0.058s
Austria, 0.049s
Mexico City, 0.041s
Median degradation by circuit, all 21 dry races of 2025
Bahrain leads by a distance, which matches its reputation: an abrasive surface and high temperatures.
At the other end, several circuits produced degradation close to zero or very slightly negative, including Azerbaijan, Las Vegas, Qatar and Monza. A slightly negative reading is not a tyre getting faster. It is track evolution: as a race progresses, rubber laid down by the whole field makes the surface grippier, and at low-degradation circuits that improvement can outpace the tyre wear. Street circuits, which start dirty, show this most.
We publish that rather than hiding it, because it is a real effect and it explains why the answer at some circuits looks strange.
The driver reports it before the data shows it
One thing a lap chart cannot give you is the moment a driver knows. Degradation arrives as a feeling several laps before it becomes a number: the rear stepping out on entry, the fronts going away, a lap time that has not moved yet but is about to.
That moment is on the radio, and it is usually blunt. "The tyres are gone" is a measurement, taken by the only instrument sitting in the car. If you want to see how a stint actually ended rather than how it looks in a table, the radio archive carries the session alongside the audio.
The honest caveats
2026 is a partial season. Ten dry races and 439 stints against 21 and 854 for 2025. The 2026 numbers will move as the season completes.
Soft has the fewest stints in both years, 127 and 50, because softs are used for short stints and qualifying, and short stints do not give enough spread of tyre age to fit a reliable slope. The soft figure is the least certain of the three.
The fuel correction is a constant, 0.030s per lap. Real fuel effect varies by circuit and by car. A per-circuit correction would be better and is a refinement we have not made.
Watching degradation live
Degradation is visible during a race before any analyst mentions it, if you watch the right column.
Our app puts every car on the circuit map during a session with a full timing tower carrying gaps, intervals, tyre compound and tyre age, pit stop counts and positions gained or lost. Watching lap time against tyre age is exactly this measurement, happening in front of you. A driver whose times drift while their tyre age climbs is a pit stop that has not been called yet.
Driver radio streams live with the transcript beside the audio, which is where degradation gets reported in the driver's own words, usually several laps before the strategy changes.
Free, no subscription, no ads. Independent, and not affiliated with Formula 1.
Tyre age is the number of laps a set of tyres has completed. A used set carries the laps it ran in earlier sessions, so tyres saved from qualifying already show a lap count before the race starts. On a timing screen it sits beside the compound letter.
How much time does each lap of tyre age cost?
In 2025, measured across 854 race stints, the soft lost about 0.048 seconds per lap of age, the medium 0.027 and the hard 0.011. After 20 laps that adds up to roughly 0.96, 0.55 and 0.22 seconds a lap.
Does the hard tyre last longer than the soft?
In 2025 it clearly did: the hard degraded about 4.4 times more slowly than the soft. In 2026 the gap has almost vanished, with the soft at 0.045 seconds per lap and the hard at 0.039 across the first ten dry races.
Why do tyres sometimes look faster as they age?
Because the car is burning fuel. It gets roughly 0.03 seconds a lap quicker as the fuel load falls, which can hide the tyre wear completely unless it is corrected for. Track evolution, as rubber builds up on the surface, has the same effect at some circuits.
---
Method and sources
Data: FastF1, 2025 and 2026 race sessions. 854 stints across 21 dry races in 2025, 439 across 10 in 2026.
Filters: green-flag laps only (track status clear), accurate laps only, no in-laps or out-laps, dry compounds only, wet and intermediate races excluded entirely, minimum stint length with a required spread of tyre ages, slowest 10% of laps per stint dropped.
Fuel correction: 0.030 seconds per lap of race distance, subtracted before fitting.
Fit: ordinary least squares slope of corrected lap time against tyre age, computed within each individual driver-stint, then aggregated by median.