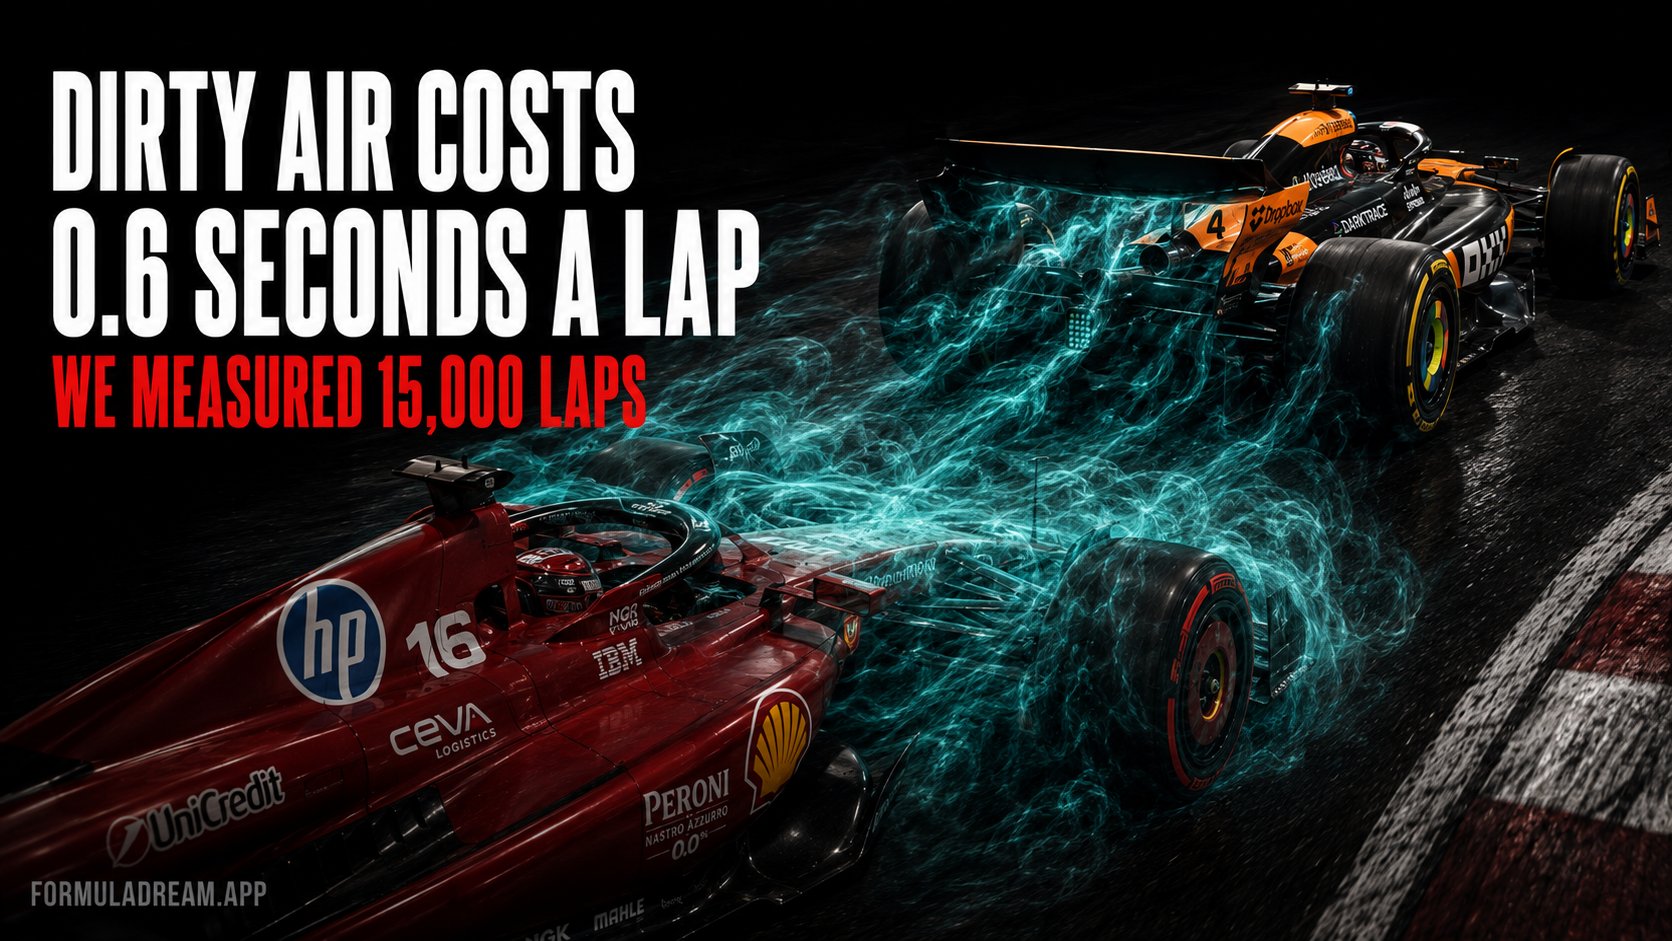
Running within one second of another Formula 1 car costs you 0.49 seconds a lap. Get right onto the gearbox, inside half a second, and it costs 0.61.
Back off to three seconds and the cost is gone entirely.
Everyone in Formula 1 talks about dirty air. Almost nobody puts a number on it in seconds. The figures you normally see are percentages of downforce lost, which is the engineer's unit, not the fan's. Here is the same thing measured the way you actually experience it, in lap time, across 9,617 racing laps.
Lap time lost while following, by gap to the car ahead, 2025 season
The hard part is the baseline. A driver's lap times move around constantly as fuel burns off and tyres wear, so you cannot simply compare a following lap to a clear lap and call the difference dirty air.
So we built each driver their own reference, stint by stint.
For every driver in every stint of every race, we fitted a straight line through only their clear-air laps, meaning laps where the car ahead was more than four seconds away. That single line absorbs fuel burn-off, which makes them faster, and tyre degradation, which makes them slower, and produces an expected lap time for any point in the stint.
Then we took every lap, worked out the gap to the car directly ahead from cumulative race times, and asked a simple question: how much slower was this lap than that driver's own clear-air pace at that exact moment in the stint?
That difference, grouped by how far behind they were, is this article.
One methodological point that matters. Our first attempt fitted the baseline through all laps, not just clear-air ones. It returned a dirty air cost of only 0.14 seconds. The reason is that about a quarter of all racing laps are spent within a second of another car, so traffic laps were setting the very baseline they were being compared against, and the effect was measuring against itself. Fitting on clear air only moved the answer from 0.14 to 0.49. We flag it because it is an easy mistake to make and it quietly deflates the result by a factor of three.
The cost falls away with distance, and that is the proof
Under 0.5s behind: 0.605s lost per lap
0.5 to 1.0s: 0.441s
1.0 to 2.0s: 0.293s
2.0 to 3.0s: 0.052s
3.0 to 4.0s: 0.005s
Over 4s, clear air: the baseline
There is an obvious objection to all of this: maybe these drivers are not losing time to turbulence at all, maybe they are just stuck behind a slower car and matching its pace.
The shape of that curve is the answer. Being held up by a slower car does not care how far behind you are. If the car ahead is simply slow, you lose the same time at three seconds as you do at half a second. An aerodynamic wake behaves completely differently: it is strongest immediately behind the car and dissipates rapidly with distance.
What we measure decays by more than 90% between half a second and three seconds. That is a wake, not a queue.
At the Hungaroring it costs 1.3 seconds. At Monza it costs nothing.
The season average hides an enormous spread.
Lap time lost while following within one second, by circuit, 2025 season
Jeddah: 1.58s
Hungaroring: 1.32s
Singapore: 0.97s
Austin: 0.81s
Suzuka: 0.69s
Bahrain: 0.61s
Interlagos: 0.51s
Barcelona: 0.50s
Imola: 0.38s
Shanghai: 0.29s
Montreal: 0.23s
Monza: 0.06s
At Monza, following another car is essentially free. That is not a glitch. Monza is the lowest-downforce circuit of the year, run with the skinniest wings on the calendar, and most of the lap is straight. A car in front takes away downforce you barely have, and in exchange it gives you a tow down three long straights. The two effects almost exactly cancel.
The Hungaroring is the mirror image. Maximum downforce, barely a straight worth the name, and corner after corner where the car is leaning on aerodynamic grip. Take 20% of that away and there is nothing to replace it with. This is the measured version of the thing every commentator says about Hungary, that you simply cannot follow there.
Monaco returns a negative number and we are not going to pretend that is a finding. At Monaco there is almost no clear air all afternoon, so the handful of "clear" laps our method finds are usually drivers cruising in a gap managing tyres, while the following laps are drivers actually pushing in a train. The baseline is contaminated. It is a limitation of the method at that one circuit, not evidence that dirty air helps at Monaco.
The 2026 cars were supposed to fix this
This is where it gets awkward.
The 2026 regulations were sold substantially on following. The FIA's stated target is that a car running 20 metres behind another retains about 90% of its downforce. For context, the 2022 rules achieved 80 to 85% at first and had decayed to roughly 70% by the end of that cycle, and the cars before 2022 were down near 50%. Nikolas Tombazis, the FIA's single-seater director, said of the new cars that "we believe it's going to be better than it's ever been."
Twenty metres, at racing speed, is somewhere between a quarter and a third of a second. That lands squarely in our closest measurement bin. So we can test the claim directly.
We ran the identical analysis on the 2026 season so far and compared like for like, using only the ten circuits that have been raced in both seasons, so the circuit mix cannot skew it.
Like-for-like comparison of following cost, 2025 and 2026, on the ten circuits run in both seasons
Under 0.5s: 0.606s in 2025, 0.856s in 2026
0.5 to 1.0s: 0.460s, then 0.417s
1.0 to 2.0s: 0.199s, then 0.253s
2.0 to 3.0s: minus 0.047s, then 0.145s
Right on the gearbox, following costs 41% more than it did last season.
What that does and does not prove
We want to be careful here, because there is a large confound and ignoring it would make this article dishonest.
In 2025 a driver within one second had DRS. In 2026 DRS does not exist. So the 2025 numbers in the two closest bins were flattered by a device that handed back time on the straights, and the 2026 numbers have no such help. Some part of that 41% is simply DRS being taken away.
So this is not proof that the 2026 cars are aerodynamically worse in traffic. The wake itself may well have improved exactly as the FIA intended.
What it does measure is the thing a driver actually experiences, and what a viewer actually sees. The net cost of sitting behind another car has gone up, not down. The FIA's argument for removing DRS was that better aerodynamics would make it unnecessary. On the evidence of eleven races, the aerodynamic gain has not yet covered what DRS was doing, at least not at the very closest range where passes are made.
The honest summary is that the closest range got worse and the mid range is roughly unchanged. The rest of the season will tell us more, and it is worth saying plainly that the 2026 sample here is 179 laps in that closest bin against 140 for 2025. It is enough to see a difference of this size, not enough to measure it to the hundredth.
What this changes about watching a race
Half a second a lap is why the pass never comes. When a driver sits two tenths behind for fifteen laps and never gets close enough, they are not being timid. They are paying about 0.6s a lap for the privilege of being there, and burning their tyres doing it.
Three seconds is the magic number. Beyond about three seconds the cost is gone. That is why a driver who cannot pass will sometimes deliberately drop back. They are not giving up, they are resetting their tyres and their pace, often to set up a proper run later.
Check the circuit before you expect overtaking. At Monza, following is free and passes happen. At the Hungaroring it costs more than a second a lap and the race is a procession. That is not driver conservatism, it is aerodynamics.
This is also the undercut connection. We measured separately that the undercut succeeds 44% of the time, and that it works best where tyres degrade. Dirty air is why: a driver stuck in traffic is destroying their tyres at 0.6s a lap, which is exactly what makes stopping early attractive.
Method
Data: FastF1. 2025, all 24 races, 9,617 classified laps. 2026, the 11 races completed at the time of writing, 5,764 laps.
Baseline: within each driver-stint, a linear fit of lap time against lap number using clear-air laps only (gap to car ahead over 4 seconds), requiring at least 5 such laps. The residual against that fit is the reported time lost.
Gap to the car ahead computed per lap from cumulative end-of-lap session times.
Excluded: in-laps and out-laps, laps 1 and 2, any lap not under green flag, deleted laps, the race leader, stints under 8 green laps, and residuals beyond 5 seconds.
The 2025 to 2026 comparison uses only the 10 circuits raced in both seasons, so the circuit mix is held constant.
Confound, stated plainly: DRS existed in 2025 within one second and does not exist in 2026. The comparison measures the net cost to a driver of following, not the aerodynamic wake in isolation. These cannot be separated from lap times alone.
Monaco is an outlier where the method breaks down, because clear-air reference laps there are rare and unrepresentative. It is reported rather than hidden.
The first version of this analysis fitted the baseline on all laps rather than clear-air laps and returned 0.14s. Because roughly a quarter of laps are traffic laps, traffic was setting its own baseline. Caught by requiring a plausible range to be declared before running.
Dirty air shows up as an interval that stops falling and tyres that stop lasting.
The Formula Dream app runs a live Dashboard through every session: every car moving on the circuit map, and a timing tower with lap times, gaps and intervals, tyre compound and age, pit counts and positions gained or lost. It is the same information these measurements come from, arriving live. You also get live driver radio as it is broadcast, and every FIA document of the weekend as it is published.
Free, no subscription, no ads, independent. Not affiliated with Formula 1.