The opening lap of a Grand Prix has a reputation for chaos. Measured across every race of the 2025 season, 38% of drivers finish lap 1 in exactly the position they started, and the average driver moves 1.2 places.
The pole sitter was still leading at the end of lap 1 in 22 of 24 races.
But whatever does happen on lap 1 is permanent. One place gained on the opening lap is worth exactly 1.00 places at the chequered flag.
Share of drivers who held, gained or lost position on the opening lap, 2025 season
Before any of the findings, one piece of housekeeping, because it is the reason we trust the rest.
Positions in a motor race are zero sum. If one driver gains a place on lap 1, some other driver must have lost it. So we added the places gained and the places lost within each race and compared them.
In all 14 races where nobody retired on the opening lap, places gained equalled places lost exactly. Every time. Net zero.
In the other 10 races the totals do not balance, and they should not: when a car crashes out on lap 1 everybody behind it moves up without anyone else moving down. The imbalance appears in precisely those races and nowhere else.
That is about as clean a validation as a dataset offers, and it means grid positions and lap 1 positions are being read correctly across 465 driver-races.
Lap 1 is calmer than its reputation
38% held their exact position
38% gained at least one place
23% lost at least one place
Average movement: 1.2 places
Biggest single gain: 8 places. Biggest single loss: 11
The opening lap gets its reputation from the exceptions, which is understandable, because the exceptions are spectacular and they are what gets replayed. But the ordinary opening lap is a fairly orderly event where roughly four drivers in ten simply hold station.
The circuit changes this enormously:
Silverstone: 2.89 places moved per driver
Las Vegas: 2.21
Red Bull Ring: 2.12
Jeddah: 1.84
Suzuka: 0.60
Montreal: 0.50
Spa: 0.00
Silverstone tops the list because that race was wet. Spa returns a perfect zero because the race began behind the safety car, so there was no racing start at all. Both are the method working correctly rather than anomalies.
The dirty side of the grid, measured
Here is the finding we did not go looking for.
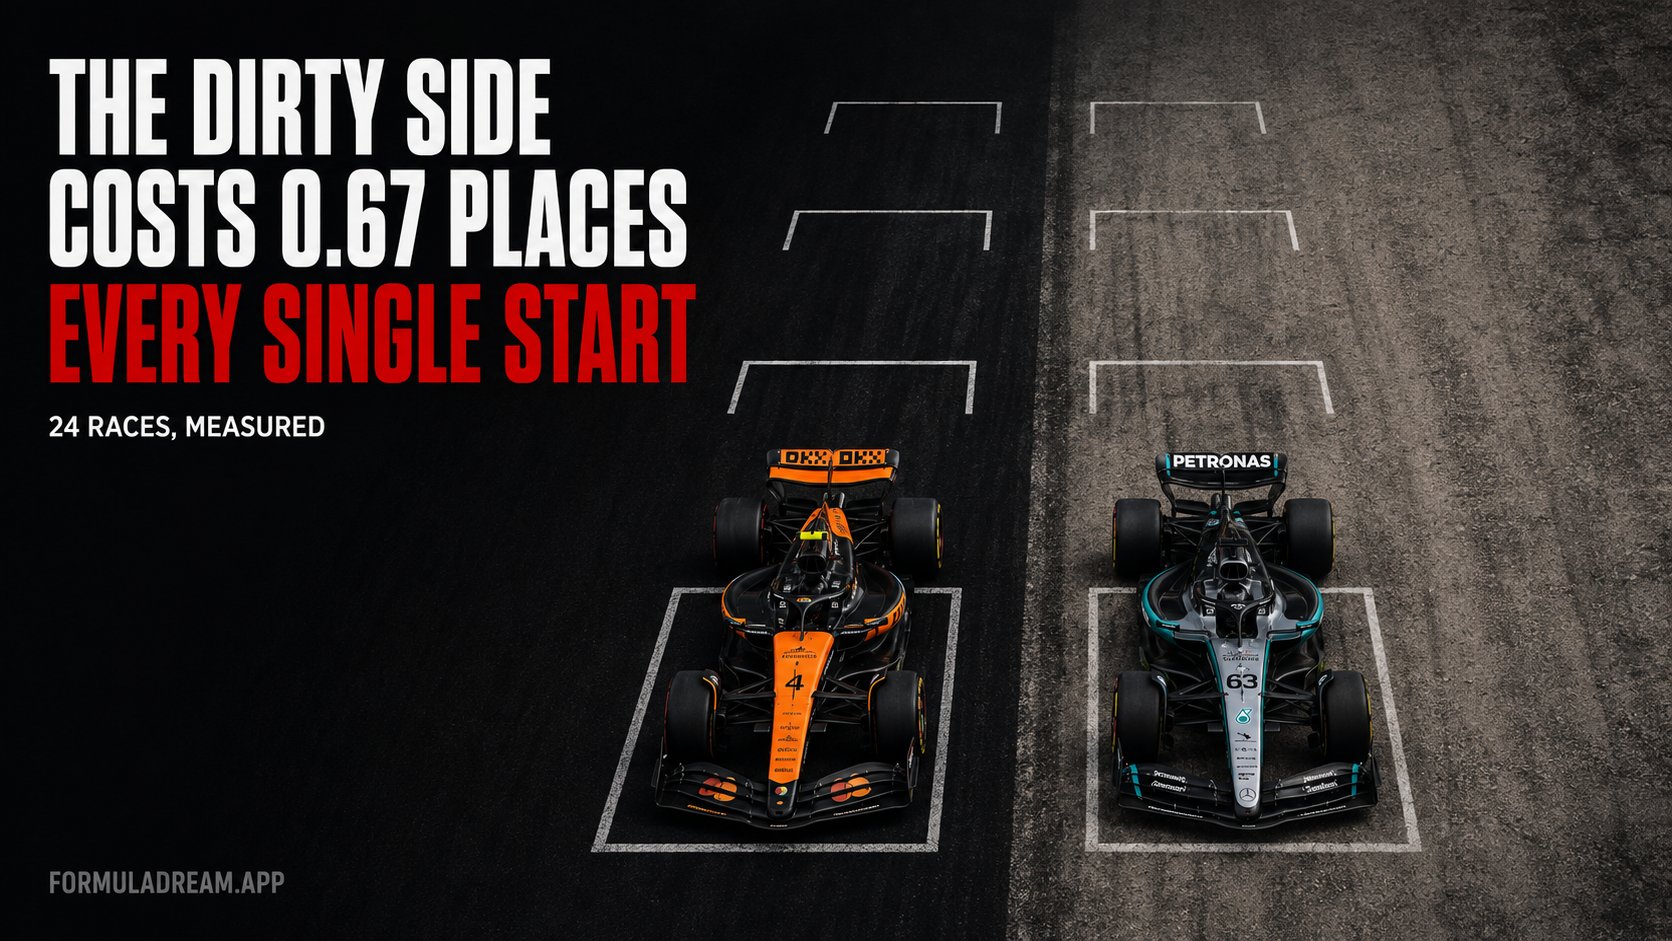
Grid slots alternate between two sides of the track. One side is the racing line, scrubbed clean and rubbered in by three days of cars. The other is the side nobody drives on, dusty and slippery, universally known as the dirty side. Every driver complains about it. Nobody publishes what it costs.
Break the average lap 1 change down by grid slot and the pattern is impossible to miss.
Average places gained on lap 1 by grid slot, showing the alternating clean and dirty side pattern
P2: minus 0.50 places
P3: plus 0.21
P4: minus 0.83
P5: plus 0.21
P6: minus 0.79
P7: plus 0.22
P8: minus 0.12
P9: plus 0.10
P11: plus 0.22
P12: minus 0.59
It alternates. Every single odd-numbered slot gains on average. Almost every even-numbered slot loses.
Across grid slots 2 to 12, the odd slots average plus 0.19 places and the even slots average minus 0.48. A difference of 0.67 places, every single start. Running a standard two-sample comparison gives t = 3.14, comfortably past the usual threshold of 2, so this is a real effect and not noise.
Why slots 2 to 12 and not the whole grid. Further back, the numbers get contaminated by simple arithmetic: a driver starting 19th can gain a lot of places and lose almost none, so the back of the grid drifts positive regardless of which side it is on. Restricting to the front half removes that and isolates the thing we actually want to measure. The effect is still visible across the whole field, just muddied.
Put in context, two thirds of a place at every start is a large penalty for something decided by which side of a coin your qualifying lap landed on. Over a season it is worth more than most drivers gain from overtaking.
Whatever you do on lap 1, you keep
The last finding is the one that gives the opening lap its real importance.
We grouped every driver by what they did on lap 1 and then looked at where they actually finished relative to their grid slot.
Where drivers finished relative to their grid position, grouped by whether they gained, held or lost on lap 1
Gained on lap 1: finished 1.88 places better than their grid slot
Held on lap 1: finished 0.21 places worse
Lost on lap 1: finished 1.92 places worse
Fit a line through every driver-race and the slope comes out at 1.00. One place gained on the opening lap translates, on average, into exactly one place at the finish.
That is a stronger result than it might look. It does not say lap 1 is where races are won, it says lap 1 gains do not get handed back. There is no regression, no drift back towards where you started. The rest of the race, on average, neither adds to nor erodes what the first ninety seconds did.
Which makes sense alongside something else we have measured: running within a second of another car costs about half a second a lap, and passing on track is difficult and expensive. A place taken at the first corner, when the field is still bunched and nobody is yet in anybody's aerodynamic wake, is the cheapest place available all afternoon.
What this changes about watching a race
Watch the even-numbered slots at the start. P2, P4 and P6 are on the dirty side and lose two thirds of a place on average. When a front-row driver gets swamped off the line, the surface is usually a bigger part of the story than the driver.
Do not expect the chaos. Roughly four drivers in ten will hold station, and the pole sitter leads into the first corner more than nine times out of ten.
Do take the first corner seriously. It is the cheapest overtaking of the day and, on average, entirely permanent.
Check the conditions before predicting a shuffle. Silverstone in the wet moved nearly three places per driver. Spa behind a safety car moved none.
Method
Data: FastF1, all 24 races of the 2025 season, 465 driver-races.
Grid position from the official session results, lap 1 position from the lap 1 timing row.
Conservation check: places gained minus places lost, per race. Exactly zero in all 14 races with no lap 1 retirement. The 10 races with a lap 1 retirement show a positive imbalance, as they must.
Drivers with no recorded lap 1 position (retired on lap 1) are excluded from that race.
The clean and dirty side comparison uses grid slots 2 to 12 to avoid back-of-grid arithmetic bias, and excludes pole because P1 can only lose places. Two-sample comparison, t = 3.14.
We treat odd slots as pole's side and even slots as the other side. This is how the grid is laid out, but which physical side is dirtier can vary by circuit, so the 0.67 figure is an average across the season rather than a constant that applies identically everywhere.
The 1.00 slope comes from a linear fit of final position change against lap 1 position change across all driver-races. Correlation is 0.41, so lap 1 explains part of the final result and clearly not all of it.
Whatever happens on the opening lap mostly sticks, which makes it worth watching closely.
The Formula Dream app runs a live Dashboard through every session: every car moving on the circuit map, and a timing tower with lap times, gaps and intervals, tyre compound and age, pit counts and positions gained or lost. It is the same information these measurements come from, arriving live. You also get live driver radio as it is broadcast, and every FIA document of the weekend as it is published.
Free, no subscription, no ads, independent. Not affiliated with Formula 1.