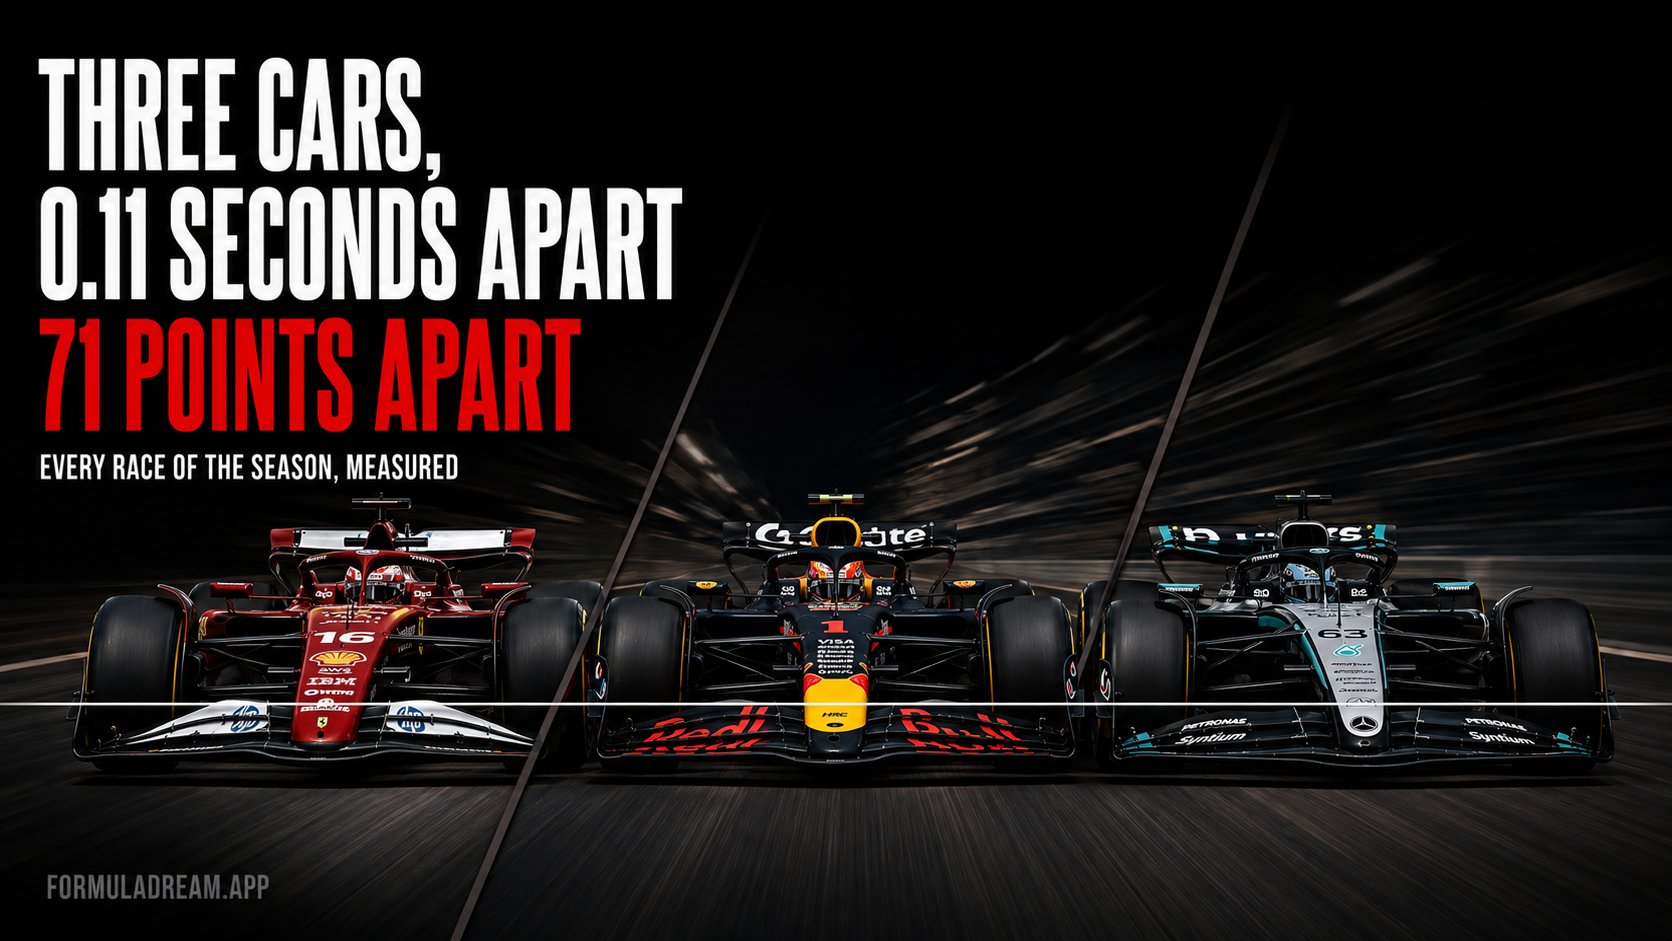
Across all 24 races of 2025, Ferrari, Red Bull and Mercedes were separated by 0.110 seconds a lap. Ferrari was the fastest of the three in nine races, Mercedes in eight, Red Bull in seven. That is not an order, it is a tie.
They scored 398, 451 and 469 championship points.
McLaren, meanwhile, had the fastest car by more than half a second, and watched that advantage halve as the season went on.
Median race lap against the field median for every team across the 2025 season
Championship points measure results. Results include strategy, reliability, penalties, safety cars, and whether your driver hit anyone at turn one. They are not a clean measurement of how fast the car was.
So we measured the car directly. For every race of 2025 we took every team's median green-flag lap time and subtracted the field's median green-flag lap time for that same race. Negative means faster than the field.
Green flag only. No in-laps, no out-laps, no deleted laps, nothing from the opening two laps. Using medians rather than best laps means one heroic lap cannot carry a team, and one disaster cannot sink them.
That gives a like-for-like number at every circuit, which can then be averaged across the season.
The order
McLaren: 1.050s faster than the field median
Ferrari: 0.450s faster
Red Bull: 0.371s faster
Mercedes: 0.340s faster
Williams: 0.115s slower
Aston Martin: 0.383s slower
Racing Bulls: 0.420s slower
Kick Sauber: 0.523s slower
Alpine: 0.561s slower
Haas: 0.573s slower
The entire grid is covered by 1.623 seconds.
Two sanity checks before going further. McLaren finished first in the constructors' championship and comes out first here. Williams finished fifth and comes out fifth here. When a pace measurement independently reproduces the top and the middle of the championship, it is measuring something real.
Where it does not reproduce the championship is where this gets interesting.
The three-way tie that produced a 71-point spread
Ferrari at 0.450s, Red Bull at 0.371s, Mercedes at 0.340s. The whole trio sits inside 0.110 seconds.
For a season-long median across 24 races, that is nothing. And the race-by-race record confirms it. Counting which of the three had the best pace at each Grand Prix:
Ferrari fastest in 9 races
Mercedes fastest in 8 races
Red Bull fastest in 7 races
There is no meaningful gap between these three cars. They took turns.
Their championship returns were Ferrari 398, Red Bull 451, Mercedes 469. A 71-point spread from cars that were, on the evidence, the same speed.
That difference is not the car. It is everything else: qualifying position, race execution, strategy calls, reliability, and who was in the seat. Ferrari in particular finished behind two teams it matched on outright pace all year.
The slowest car on the grid outscored Alpine
The bottom of the table produces something starker.
Measured race pace plotted against championship points for the 2025 season
Haas had the slowest car of 2025 by our measurement, at 0.573s off the field median. Alpine's car was 0.561s off. The difference between them is 0.012 seconds, which is nothing at all.
Haas scored 79 points. Alpine scored 22.
Two cars of identical speed, and one scored three and a half times what the other did. Alpine finished last in the constructors' championship with a car that was not the slowest on the grid.
Kick Sauber tells a similar story from the other direction: 0.523s off the pace, marginally quicker than both, and 70 points.
If you want a single illustration of how much of a Formula 1 result is not the car, it is Haas and Alpine, separated by twelve thousandths of a second and 57 points.
It was not reliability either
The obvious explanation for Alpine is that the car kept breaking. We checked, and it did not.
Alpine retired from 8.5% of their starts. The field average was 10.7%. Alpine's reliability was better than the grid's, not worse.
The contrast that settles it is Williams. Williams had the worst retirement rate on the grid, 17.0%, and finished fifth in the championship with 137 points. Alpine retired half as often and scored 22.
The difference shows up in finishing positions rather than finishes. Alpine managed 5 top-ten finishes all season. Haas, in a car 0.012s slower, managed 18. Williams managed 21 despite retiring more than anyone. Whatever went wrong at Alpine in 2025, it was neither the car's outright speed nor its reliability.
McLaren's advantage halved
Splitting the season into its first twelve races and its last twelve shows the shape of the year.
Race pace in the first 12 races compared with the last 12
McLaren: 1.156s clear, then 0.685s clear. They lost 0.471s of their advantage.
Ferrari: 0.598s, then 0.353s
Haas: 0.602s off, then 0.271s off. The biggest improvement of anyone, 0.331s.
Kick Sauber: 0.613s off, then 0.372s off
Alpine: 0.520s off, then 0.699s off. The only team to clearly go backwards.
McLaren still had the best car at the end of the year. But a car that began the season more than a second clear of the field median finished it less than seven tenths clear, and that is the difference between a race being over at the first corner and a race being a contest.
This matches what the paddock was saying at the time. Red Bull publicly argued after the summer break that McLaren had lost relative pace, and our measurement, taken independently from lap times, agrees with them.
What this changes about reading a championship table
A points table is a results table, not a pace table. Mercedes finished second with the fourth-fastest car. Ferrari finished fourth with a car that matched them.
Small pace gaps produce large points gaps. 0.110 seconds separated three teams and 71 points separated them too. Formula 1 amplifies tiny differences.
The bottom of the grid is closer than the table suggests. Alpine, Haas and Kick Sauber were covered by 0.05 seconds. Their points were 22, 79 and 70.
Watch the second half of a season for development, not the first. The order barely changed in 2025. The gaps changed a lot.
Method
Data: FastF1, all 24 races of the 2025 season.
For each race: team median green-flag lap minus field median green-flag lap. A team needs at least 20 usable laps in a race to be included, and a driver at least 10.
Excluded: any lap not under green flag, in-laps, out-laps, deleted laps, and laps 1 and 2.
Season figure is the median of a team's 24 per-race values, so one bad weekend cannot distort it.
Points are summed from race and sprint classifications in the same dataset, across 30 scoring sessions.
Retirement rates count entries classified as "Retired" as a share of starts, across 476 starts in 2025. The data source does not separate mechanical failures from accidents for this season, so these are total retirements from any cause.
This measures the car and driver together. A team's median lap reflects both. It is not a pure car-performance metric and no lap-time method can be.
It is also affected by where a team spends the race. A car running in clear air at the front will show slightly better pace than the same car stuck in traffic, and we have measured that dirty air costs about half a second a lap. This flatters the leading teams somewhat. It does not come close to explaining a 71-point spread across three cars within 0.110s.
Two teams have 23 races rather than 24 because they did not meet the lap threshold in one event.
Race pace is invisible early and obvious by lap thirty, if you are watching lap times.
The Formula Dream app runs a live Dashboard through every session: every car moving on the circuit map, and a timing tower with lap times, gaps and intervals, tyre compound and age, pit counts and positions gained or lost. It is the same information these measurements come from, arriving live. You also get live driver radio as it is broadcast, and every FIA document of the weekend as it is published.
Free, no subscription, no ads, independent. Not affiliated with Formula 1.
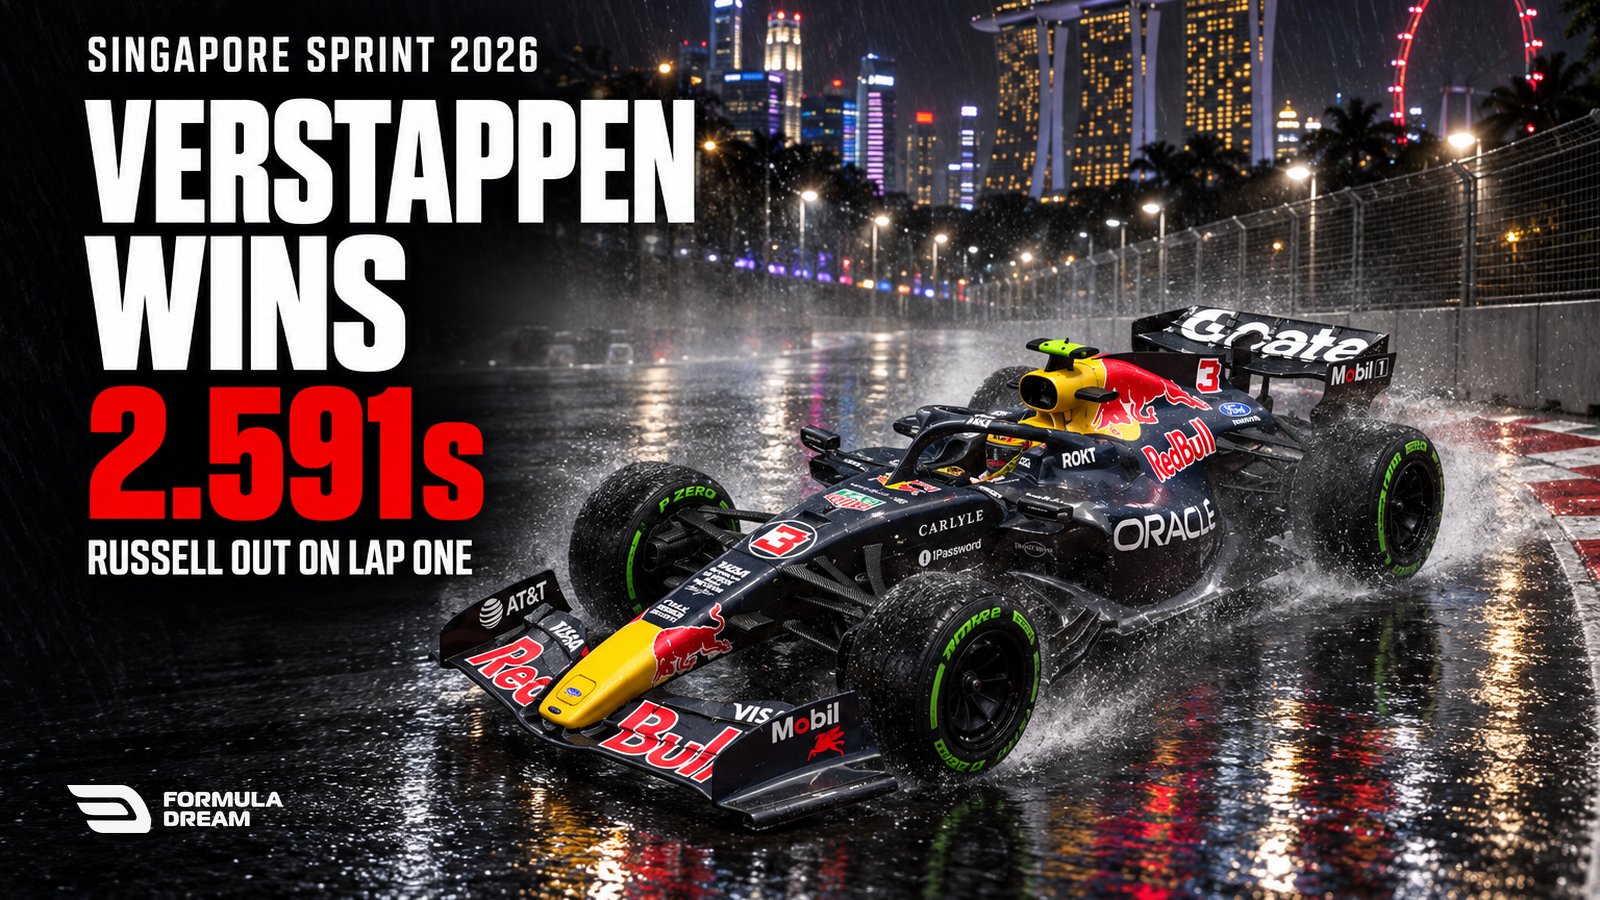
Singapore Sprint 2026 Results: Russell Crashes From the Lead
Russell took the lead at turn one and crashed at the final corner of the same lap. Verstappen won, Hamilton charged to second, and the McLarens hit each other.