Across the 2025 season, the fastest team through the speed trap was 3.75 km/h quicker than the slowest. Five of the ten teams were identical to the nearest km/h.
Over the same season those same ten teams were separated by 1.623 seconds of lap time.
Formula 1 cars are not separated in a straight line. Almost the entire difference between them happens in the corners.
Median and maximum speed trap readings by circuit across the 2025 season
Every lap of a Grand Prix records a speed trap figure, and we pulled all of them for the 2025 season. Two numbers matter and they say different things.
The maximum is the single highest reading of the race. It is the headline number, and it is nearly always a car with a tow and an open rear wing. It describes a situation more than a car.
The median is what a car actually does on a normal lap. It is the more honest figure.
On maximum, Monza tops the season at 364 km/h, exactly as you would expect from the lowest-downforce circuit of the year.
On median, it does not. Mexico City comes out fastest at 328 km/h, with Monza second at 326.
The reason is altitude. The Autódromo Hermanos Rodríguez sits 2,285 metres above sea level, comfortably the highest circuit on the calendar, with roughly 25% less air density than sea level. Less air means less drag. It also means less downforce and less power, which is why teams run big wings there and still go faster than almost anywhere else.
It is not a fluke of our data either. Mexico holds the all-time Formula 1 speed trap record: Valtteri Bottas at 372.5 km/h in 2016.
At the other end, Monaco tops out at a median of 279 km/h and a maximum of 291, the only circuit of the year where nobody broke 300.
Mexico City: 328 median, 363 max
Monza: 326, 364
Baku: 322, 333
Las Vegas: 322, 358
Shanghai: 315, 351
Jeddah: 313, 343
Montreal: 310, 344
Suzuka: 300, 311
Red Bull Ring: 295, 321
Hungaroring: 289, 319
Singapore: 285, 305
Monaco: 279, 291
The spread from Mexico to Monaco is 49 km/h, which is a far bigger difference than anything between the cars themselves.
There is no top speed ranking in 2025
Now the team comparison, which produced a result we did not expect.
Straight-line speed by team relative to the field median, 2025 dry races
Measuring each team's speed trap against the field median at the same race, across dry races only:
Mercedes: 2.25 km/h faster than the field median
Williams: 2.00
Haas, Ferrari, McLaren, Aston Martin, Red Bull: 0.00
Kick Sauber, Racing Bulls: 1.00 slower
Alpine: 1.50 slower
Five teams are indistinguishable. The speed trap records whole km/h, and across a season those five land on exactly the same value as the field. The total spread, fastest to slowest, is 3.75 km/h.
We are not going to dress that up as a ranking. It is not one. Mercedes and Williams are measurably quicker in a straight line, Alpine measurably slower, and in between the data genuinely cannot separate the teams.
That is the finding, and it is more interesting than a table would have been.
Put the two side by side as a share of a typical value and the contrast is stark.
The grid's spread in straight-line speed compared with its spread in lap time
Straight-line speed varies across the grid by about 1.2%
Lap time varies by about 1.8%
Those look close until you work out what 3.75 km/h is actually worth. On a one-kilometre straight at around 310 km/h, carrying an extra 3.75 km/h saves in the region of a tenth and a half. Even a circuit with two or three long straights cannot turn that into more than about half a second.
The lap time gap is 1.623 seconds. Straight-line speed can account for a fraction of it. The rest is cornering, braking, traction and tyre behaviour.
This also explains something that looks strange in the numbers above. McLaren had the fastest car of 2025 by more than half a second a lap, and were exactly average through the speed trap. They were not fast because they were slippery. They were fast everywhere else.
What this changes about watching a race
Stop reading the speed trap column as a performance table. It tells you about wing level and whether a driver had a tow, not about how good the car is.
A car that is quick in a straight line is often compensating. Running less wing buys top speed and costs cornering. Mercedes and Williams sat at the top of the speed trap and fourth and fifth on race pace.
Altitude beats aerodynamics. Mexico runs high-downforce wings and still records the highest average speeds of the year, because there is a quarter less air to push through.
Monaco really is a different sport. 279 km/h median, and no car broke 300 all weekend.
Method
Data: FastF1, all 24 races of the 2025 season, using the per-lap speed trap value (SpeedST), which is recorded on essentially every lap and needs no telemetry.
Green flag laps only. No in-laps, no out-laps, nothing from laps 1 and 2.
Circuit median is the median of all qualifying laps in that race. Circuit maximum is the single highest reading.
Team figures compare each team's median against the field median at the same race, then take the median across races. Wet races (Australia, Britain, Belgium) are excluded from the team comparison because wet running depresses speeds unevenly. They remain on the circuit chart, labelled.
Resolution limit, stated plainly: the speed trap reports whole km/h. That is why five teams land on exactly 0.00 and why we do not present a team ranking. The instrument is not precise enough to separate them over a season.
Speed trap readings include the effect of slipstream and, in 2025, an open rear wing. The median dilutes both but does not remove them.
The lap time comparison uses our own race pace measurement of the same season.
Trap speeds are set on specific laps, in specific conditions, with a specific tow.
The Formula Dream app runs a live Dashboard through every session: every car moving on the circuit map, and a timing tower with lap times, gaps and intervals, tyre compound and age, pit counts and positions gained or lost. It is the same information these measurements come from, arriving live. You also get live driver radio as it is broadcast, and every FIA document of the weekend as it is published.
Free, no subscription, no ads, independent. Not affiliated with Formula 1.
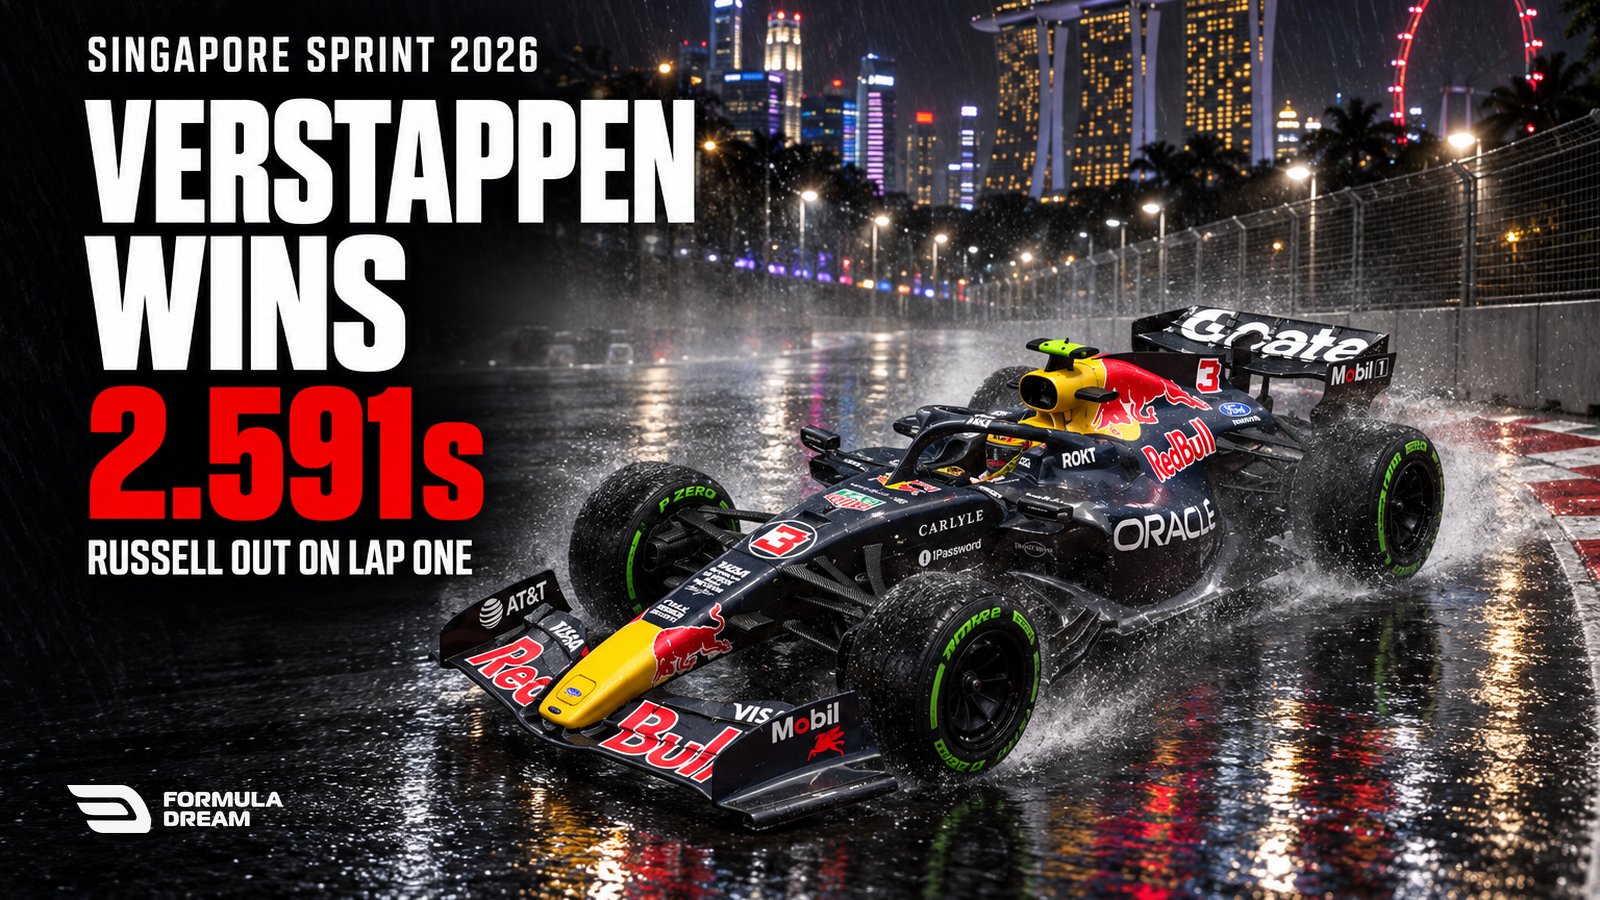
Singapore Sprint 2026 Results: Russell Crashes From the Lead
Russell took the lead at turn one and crashed at the final corner of the same lap. Verstappen won, Hamilton charged to second, and the McLarens hit each other.