F1 2026 Tracks: Every Circuit Map, Drawn From Telemetry
Guides
Every 2026 F1 circuit, drawn by the car itself
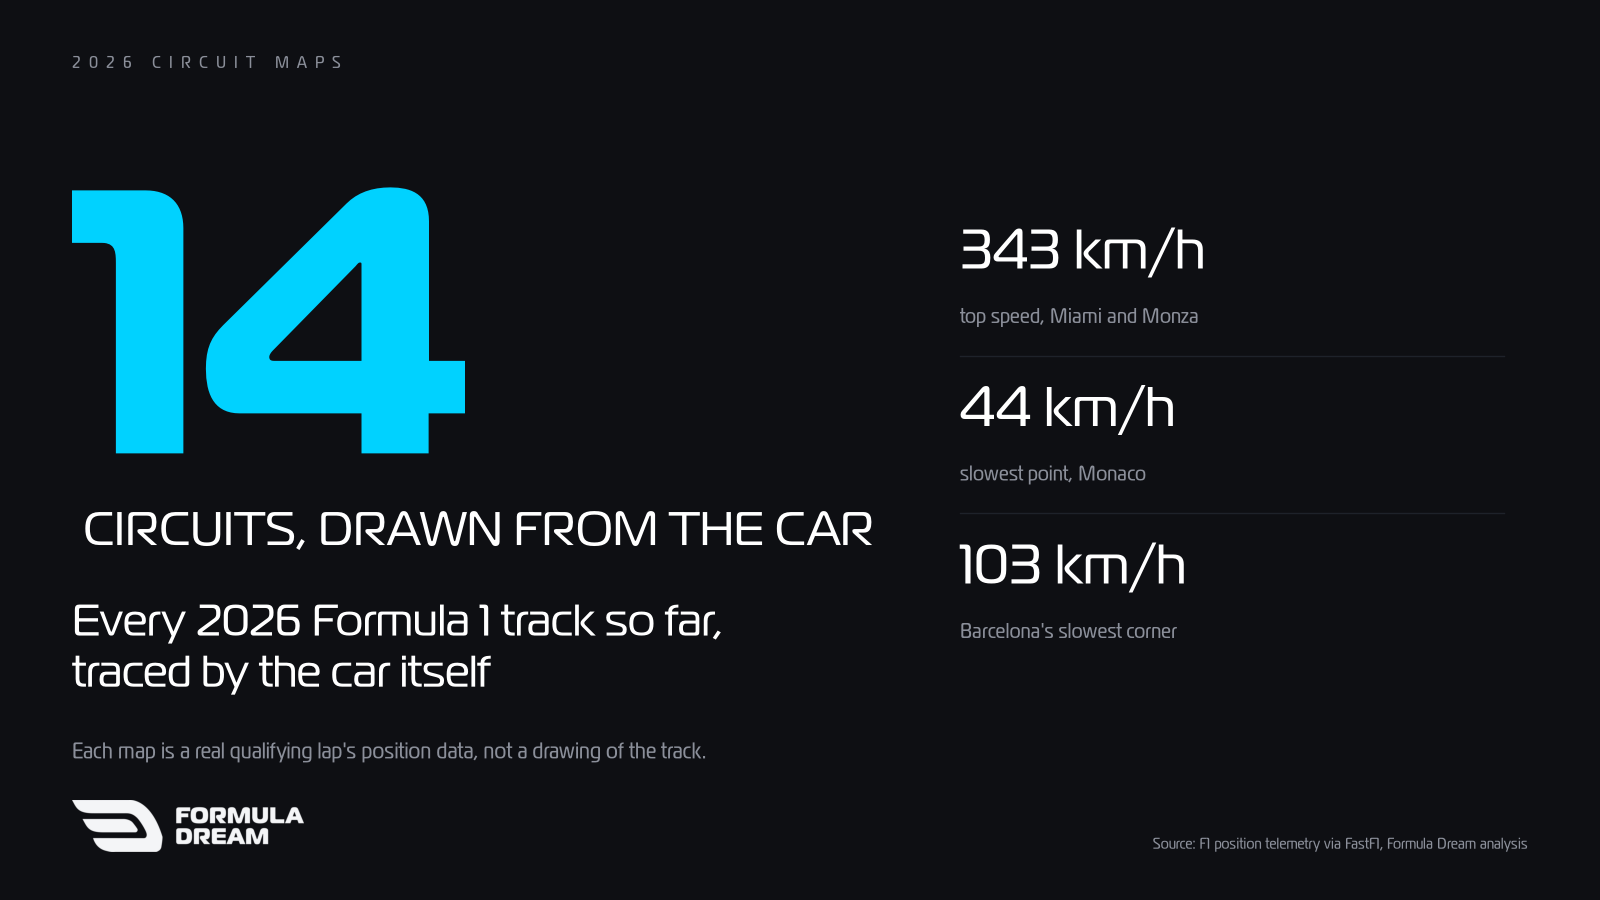
Fourteen maps of every Formula 1 track raced in 2026, each drawn from a real qualifying lap's position data rather than traced. Top speeds, slowest corners and the circuits that never drop below 100 km/h.
Most circuit maps you have seen were drawn by a designer from an aerial photo. These fourteen were drawn by a Formula 1 car.
Every car on the grid reports its position on track several times a second. Take one real qualifying lap, plot where the car actually was, and the circuit draws itself: not the centreline an architect drew, but the path a driver chose at full commitment, cutting across the kerbs and running out to the white line on exit. That is the shape below for every track raced so far in 2026.
Each map also marks the slowest points of that lap, found in the speed trace rather than copied from an official corner list, alongside the lap time, the top speed and the slowest corner. The most recent race on it is Madrid, and every message from that weekend is in our
, with the audio and a transcript coloured by who is speaking.
All fourteen, in calendar order
Image gallery, 14 slides
1 / 14
Albert Park, Melbourne. Russell, 1:18.518.
The numbers behind the maps
The first seven rounds:
Circuit
Fastest qualifying lap
Top speed
Slowest point
Albert Park
1:18.518, Russell
327 km/h
94 km/h
Shanghai
1:32.064, Antonelli
332 km/h
68 km/h
Suzuka
1:28.778, Antonelli
326 km/h
76 km/h
Miami
1:27.798, Antonelli
343 km/h
69 km/h
Montreal
1:12.578, Russell
332 km/h
60 km/h
Monaco
1:12.051, Antonelli
289 km/h
44 km/h
Barcelona
1:14.679, Russell
341 km/h
103 km/h
Speeds are from the lap drawn on each map. At Suzuka that is Piastri's lap, not Antonelli's.
The next seven:
Circuit
Fastest qualifying lap
Top speed
Slowest point
Red Bull Ring
1:06.113, Russell
329 km/h
71 km/h
Silverstone
1:28.111, Antonelli
317 km/h
87 km/h
Spa
1:44.361, Antonelli
336 km/h
75 km/h
Hungaroring
1:17.207, Norris
331 km/h
92 km/h
Zandvoort
1:11.163, Norris
316 km/h
93 km/h
Monza
1:21.786, Gasly
343 km/h
69 km/h
Madring
1:31.824, Norris
334 km/h
81 km/h
At Monza the speeds are from Russell's lap, for the reason explained below.
What the maps say
Miami and Monza share the highest top speed, 343 km/h. That is less obvious than it sounds. Monza is built for top speed from end to end, while Miami has a slow, fiddly section by the stadium. What Miami has instead is a very long back straight.
Monaco's slowest point is 44 km/h, the lowest anywhere, and its top speed of 289 km/h is the only one below 300. Its slowest point is barely 15% of its top speed, the widest spread of the fourteen relative to how fast the car goes.
Montreal is next slowest at 60 km/h, at its hairpin. Montreal is a lap of long straights into slow corners, which is why it is known as one of the hardest circuits of the year on brakes.
Barcelona never drops below 103 km/h. It is the only circuit of the fourteen with no point on the lap under 100 km/h. Zandvoort (93), Albert Park (94) and the Hungaroring (92) come closest. Those are flowing layouts, and several of them are notoriously hard places to overtake: without one big stop at the end of a straight, there is nowhere obvious to outbrake someone.
Spa and the Madring have the most slow points, 11 each. Spa's come from its length, seven kilometres of lap. The Madring's come from its layout: a street-style circuit with a lot of direction changes packed into an ordinary lap length. Our measurement of how little overtaking Madrid produced is the other half of that story.
Why two maps use a different driver's lap
The lap time on every map is the fastest of qualifying, which is timing data and cannot be wrong. The drawing and the speeds come from the car's own sensors, and occasionally those drop out.
At Monza, Pierre Gasly's fastest lap has a stretch of nearly five seconds where the speed channel stops updating and simply repeats its last value. At Suzuka, Kimi Antonelli's fastest lap fails the same check. Faulty speed data invents flat sections and hides real braking, and on Antonelli's lap it produced seventeen "slow points" where a clean lap shows seven.
So for those two circuits the map and the speeds come from the fastest lap whose data passes our checks: George Russell's at Monza and Oscar Piastri's at Suzuka. The lap times credited to Gasly and Antonelli stand. We measured the Monza fault in detail in our Monza track analysis.
What this measures, and what it does not
A top speed from one lap is not the circuit's record. It depends on the car, the wing level the team chose, and whether the driver had a tow. It tells you what the fastest lap of qualifying reached, not the highest speed anyone saw all weekend.
The numbered rings are not official corner numbers. They mark where the car was slowest, measured from the speed trace. Official turn counts include kinks taken flat out, so they are always higher: the Madring has 22 official turns and 11 slow points.
The shape is the racing line, not the track's centreline, so it is slightly shorter than the official lap length and cuts every apex. That is the point of it.
The rounds still to come, starting with Baku on 26 September, get their maps when they have been raced. For every circuit in more depth, the circuits hub collects each track's qualifying gaps and team radio, and our ranking of the fastest F1 circuits compares average lap speeds.
Frequently asked questions
Which F1 circuit has the highest top speed in 2026?
Of the fourteen raced so far, Miami and Monza share the highest top speed on the fastest qualifying lap, 343 km/h, with Barcelona close behind at 341 km/h. Top speed on a single lap depends on the car's setup and on having a tow, so these are not all-time records.
What is the slowest corner in Formula 1?
Monaco's, at 44 km/h on the fastest qualifying lap of 2026. Montreal's hairpin is next at 60 km/h.
Which F1 circuits have no slow corners?
Barcelona is the only 2026 circuit so far whose slowest point on the fastest qualifying lap stayed above 100 km/h, at 103 km/h. Zandvoort, Albert Park and the Hungaroring all stay above 90 km/h.
How are these F1 track maps made?
Each one is plotted from the position data a Formula 1 car transmits during a real qualifying lap, taken from Formula 1's timing feed through the FastF1 project. Nothing is traced from an image, so the shape is the racing line the driver actually took.
Sources
Position, speed and lap timing data: Formula 1 live timing, accessed through the open-source FastF1 library
Official turn count for the Madring: Formula 1 circuit information for the 2026 Spanish Grand Prix
Every radio message referenced: our own team radio archive
Hear it as it happens
A map shows where the car goes. The radio tells you what the driver thought of it.
The Formula Dream app plays live driver radio as it is broadcast, transcript beside the audio, and collects every FIA document of the weekend as the stewards publish it: the penalties, the protests and the decisions that change results after the flag. There is also a live timing Dashboard, currently in beta.
Free, no subscription, no ads, independent. Not affiliated with Formula 1.
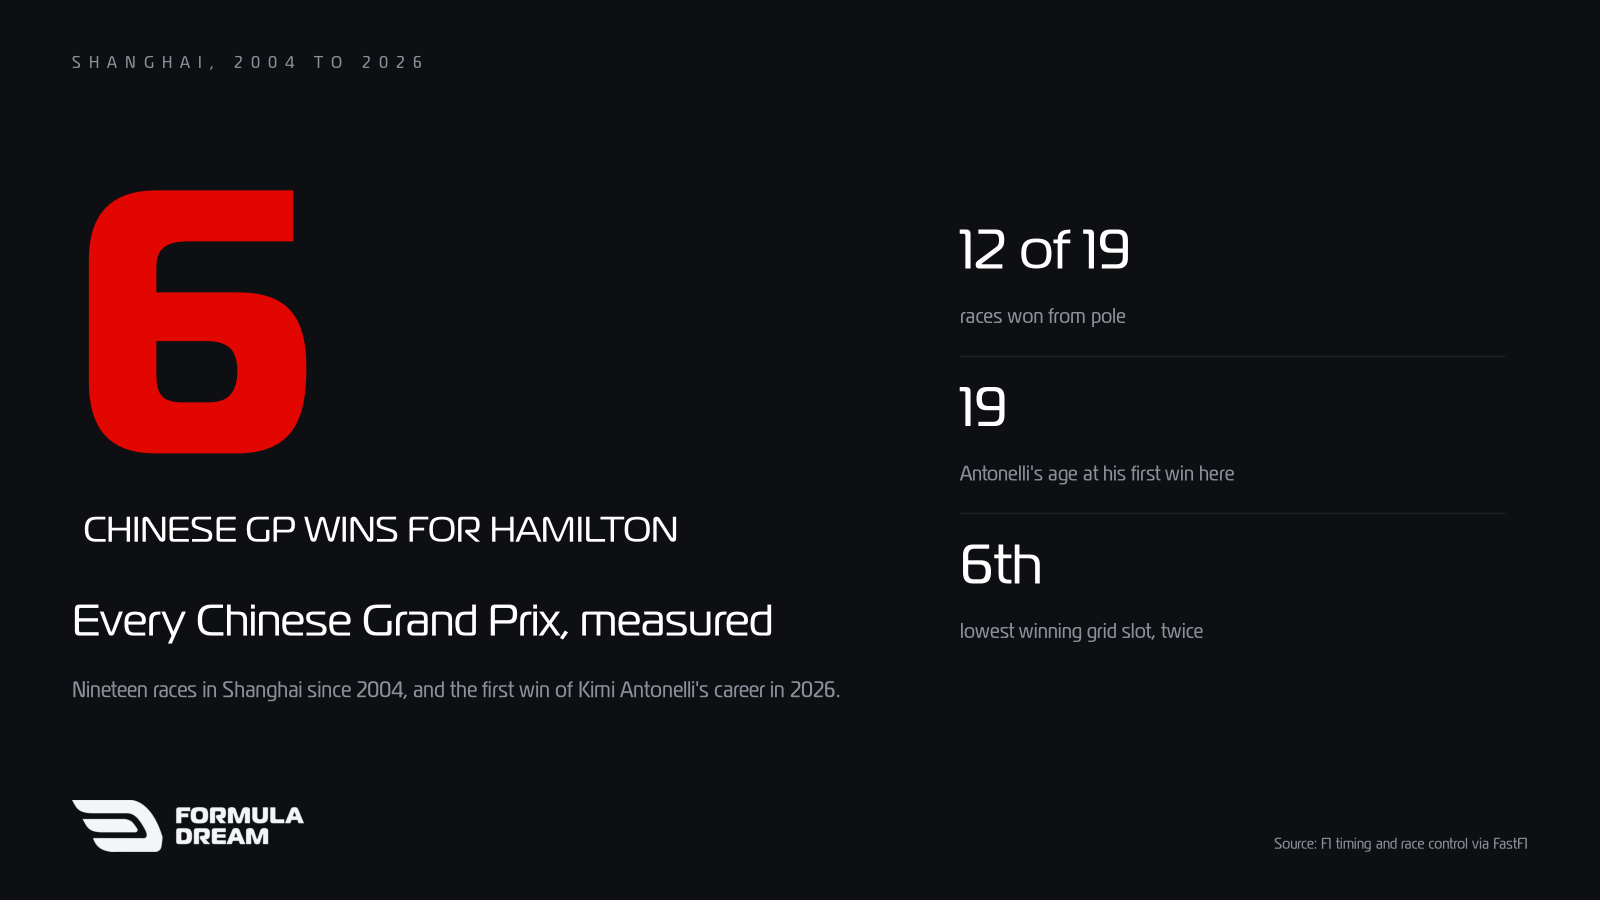
Nineteen Chinese Grands Prix have been held in Shanghai since 2004. Lewis Hamilton won six, pole won twelve, and in 2026 Kimi Antonelli took the first win of his career there, at 19, with Hamilton on the podium for Ferrari for the first time. Every winner, grid slot and safety car, measured.