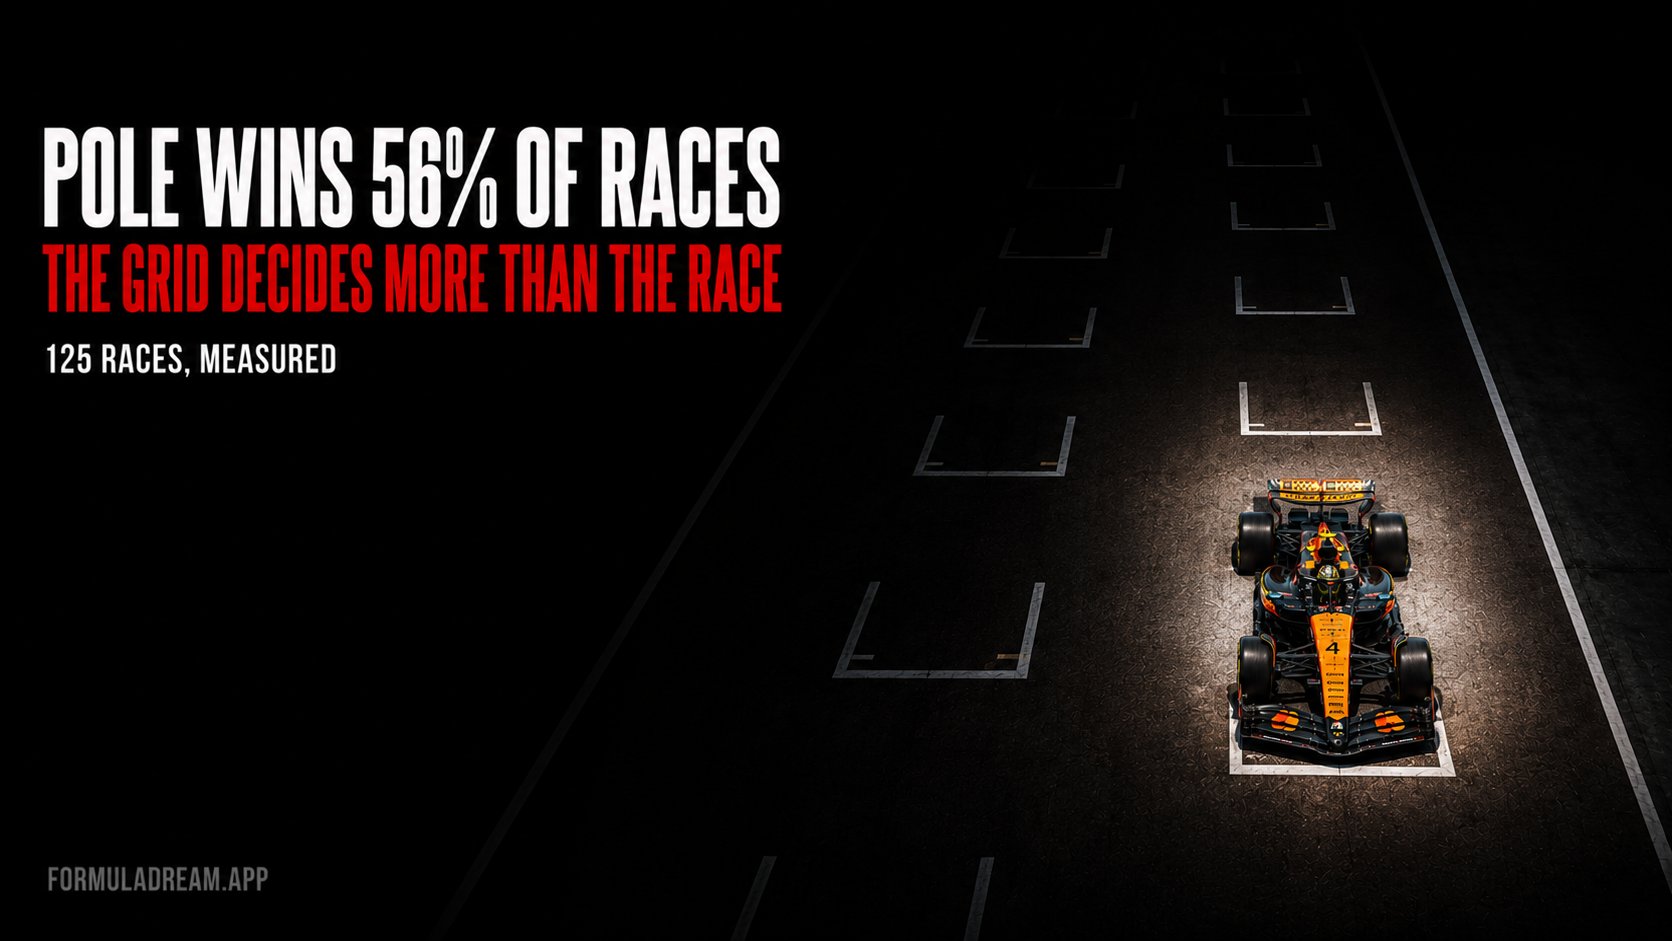
The front row won 77.6% of races. The top three grid slots won 87.2%.
Only two races in 125 were won from outside the top ten on the grid. Both of them were Max Verstappen: Spa in 2022 from P14, and Interlagos in 2024 from P17. A third came at Monza in 2026, after this sample closed, when Kimi Antonelli won from P19.
Win, podium and points probability for every starting position across 125 races
The check that makes this trustworthy
Every driver's starting position and finishing position, for every race between 2021 and 2026. That is 2,492 driver-races across 125 Grands Prix.
Before looking at anything else we ran the accounting: 125 races should produce exactly 125 winners. They did. If grid or finishing positions were being misread, that total would not land exactly.
What each grid slot is actually worth
Most coverage of this question stops at pole. The more useful question is what any given slot buys you.
P1: wins 56.0%, podium 79.2%, points 88.8%
P2: wins 21.6%, podium 73.6%, points 90.4%
P3: wins 9.6%, podium 48.0%, points 86.4%
P4: wins 4.0%, podium 38.4%, points 88.8%
P5: wins 0.8%, podium 20.8%, points 80.0%
P6: wins 2.4%, podium 10.4%, points 82.4%
P8: wins 0.8%, podium 1.6%, points 66.1%
P10: wins 1.6%, podium 3.2%, points 54.8%
P11: never won, podium 1.6%, points 42.7%
P15: never won, podium 2.4%, points 25.8%
P20: never won, podium 1.0%, points 14.4%
The win column falls off a cliff after the front row. Pole to P2 loses you more than half your chance of winning. P2 to P5 removes almost all of what is left.
The podium column collapses more gradually, and the points column more gradually still. From P10 you have a coin-flip chance of scoring and effectively no chance of winning. That, in one line, is what a qualifying lap is worth.
The most revealing single number is P11 to P20: just two wins between them across 125 races, Verstappen's from P14 and P17, the only marks on that entire half of the grid.
Races are won on Saturday
The share of races won from pole, the front row, the top three and the top ten on the grid
From pole: 56.0% of races
From the front row: 77.6%
From the top three: 87.2%
From the top ten: 98.4%
The last figure is the one to sit with. In 125 races, 123 were won by someone who qualified in the top ten.
Formula 1 sells itself on Sunday, and Sunday is genuinely where the racing happens. But the range of possible winners is set on Saturday afternoon, and it is a narrow range.
Qualifying matters more now than it used to
The published all-time pole-to-win conversion rate, across more than 1,100 Grands Prix, is roughly 43.6%. Our modern sample gives 56.0%.
That is a substantial difference and it points one way: starting position decides more in the current era than it did historically.
The reasons are not mysterious, and we have measured most of them ourselves.
The undercut is not a reliable escape. It works 44% of the time, which makes it a gamble rather than a plan.
Reliability has improved enormously. Historically a large share of races were won by drivers who inherited the lead when a faster car broke. Modern cars mostly finish, so the leader mostly stays the leader.
The grid barely moves
The last chart is the one that surprised us least and matters most.
Median places gained or lost from each grid position across 125 races
The median position change from most grid slots is zero. Pole finishes first in the median case. P8 finishes eighth or ninth. Only from about P14 backwards does the typical driver gain anything, and even then it is one to four places.
A note on why this is a median rather than an average. A retirement gets classified near the back, so a pole sitter who breaks down is recorded as losing eighteen or nineteen places. Averaging that in produces a mean of minus 2.66 for pole position, which would suggest pole sitters typically finish fourth. They do not. They typically finish first. The median is the honest statistic here and the mean is actively misleading.
That retirement effect is real, though, and worth its own number: 11.5% of drivers starting in the top three scored no points at all.
Update: Monza 2026 broke the pattern
The figures above cover 125 races, to the 2026 Hungarian Grand Prix. Two more have been run since, and one of them is exactly the kind of exception this page describes.
At the 2026 Dutch Grand Prix, Lando Norris won from pole. At the 2026 Italian Grand Prix, Kimi Antonelli won from 19th on the grid, after a power unit penalty, helped by a red flag after three laps that gave the whole field a free tyre change and a standing restart.
Across all 127 races that makes pole 71 wins, 55.9%, and puts the number of winners from outside the top ten at three. Antonelli's win from 19th is the joint second lowest grid position a Grand Prix has ever been won from, level with Bill Vukovich at the 1954 Indianapolis 500 and behind only John Watson, who won from 22nd at Long Beach in 1983.
What this changes about watching a race
Saturday is not a warm-up. It sets the win probability, and after the front row that probability is mostly gone.
A driver out of position is in real trouble. Qualifying eleventh in a car capable of winning means, on this evidence, not winning.
Do not confuse a good recovery drive with a normal one. The median driver gains nothing. Recoveries feel common because they are memorable, not because they are frequent.
The exceptions are worth knowing by name. Spa 2022 and Interlagos 2024, both Verstappen, and Monza 2026, Antonelli, every one of them in wet or disrupted conditions. That is what it takes.
The first thirty seconds, in their own words
Everything above is measured from where cars finished relative to where they started. What it cannot show is the part that decides it, which is the run to the first corner.
The radio does. A start is preceded by a countdown and followed immediately by either silence or a very fast conversation, and which one you get tells you how the first corner went before any timing data updates. The archive holds the race sessions with the audio, so you can hear a grid position being won or thrown away.
Method
Data: FastF1 race classifications, every Grand Prix from 2021 to 2026 for which results loaded, being 125 races and 2,492 driver-races.
Grid position and finishing position taken from the official classification. Entries with no grid position, such as pit lane starts recorded as zero, are excluded.
Accounting check: 125 winners across 125 races, exactly.
Podium means a classified finish in the top three. Points means any points scored, which through this period means a top-ten finish, plus the fastest lap point where it applied.
Position change is reported as a median, because retirements are classified near last and destroy a mean. Both figures are given in the article so the difference is visible.
2026 contributes 11 races, to the Hungarian Grand Prix. The Dutch and Italian Grands Prix are covered separately in the update above, using the winner's grid position from the official classification.
This mixes regulation eras, including the 2022 aerodynamic change and the 2026 change. That is deliberate, since the question is about the modern era as a whole, but it means the 56% is an average across a period in which the true rate almost certainly moved.
The all-time 43.6% figure is external, from published records covering more than 1,100 races, and is cited rather than measured by us.
Frequently asked questions
How often does pole position win in F1?
In the 125 races from 2021 to the 2026 Hungarian Grand Prix, pole won 56.0% of the time, against about 43.6% across Formula 1's whole history. Including the Dutch and Italian Grands Prix of 2026, the modern rate is 55.9%.
Do you get points for pole position in F1?
No. Points are awarded only for finishing positions, to the top ten in a Grand Prix and the top eight in a sprint. The bonus point for fastest lap was scrapped from 2025, so qualifying on pole scores nothing by itself.
What is the lowest grid position to win an F1 race?
22nd, by John Watson at the 1983 United States Grand Prix West in Long Beach. Kimi Antonelli's win from 19th at the 2026 Italian Grand Prix is joint second, level with Bill Vukovich at the 1954 Indianapolis 500.
What a grid slot is worth is settled in the first few corners.
The Formula Dream app runs a live Dashboard through every session: every car moving on the circuit map, and a timing tower with lap times, gaps and intervals, tyre compound and age, pit counts and positions gained or lost. It is the same information these measurements come from, arriving live. You also get live driver radio as it is broadcast, and every FIA document of the weekend as it is published.
Free, no subscription, no ads, independent. Not affiliated with Formula 1.
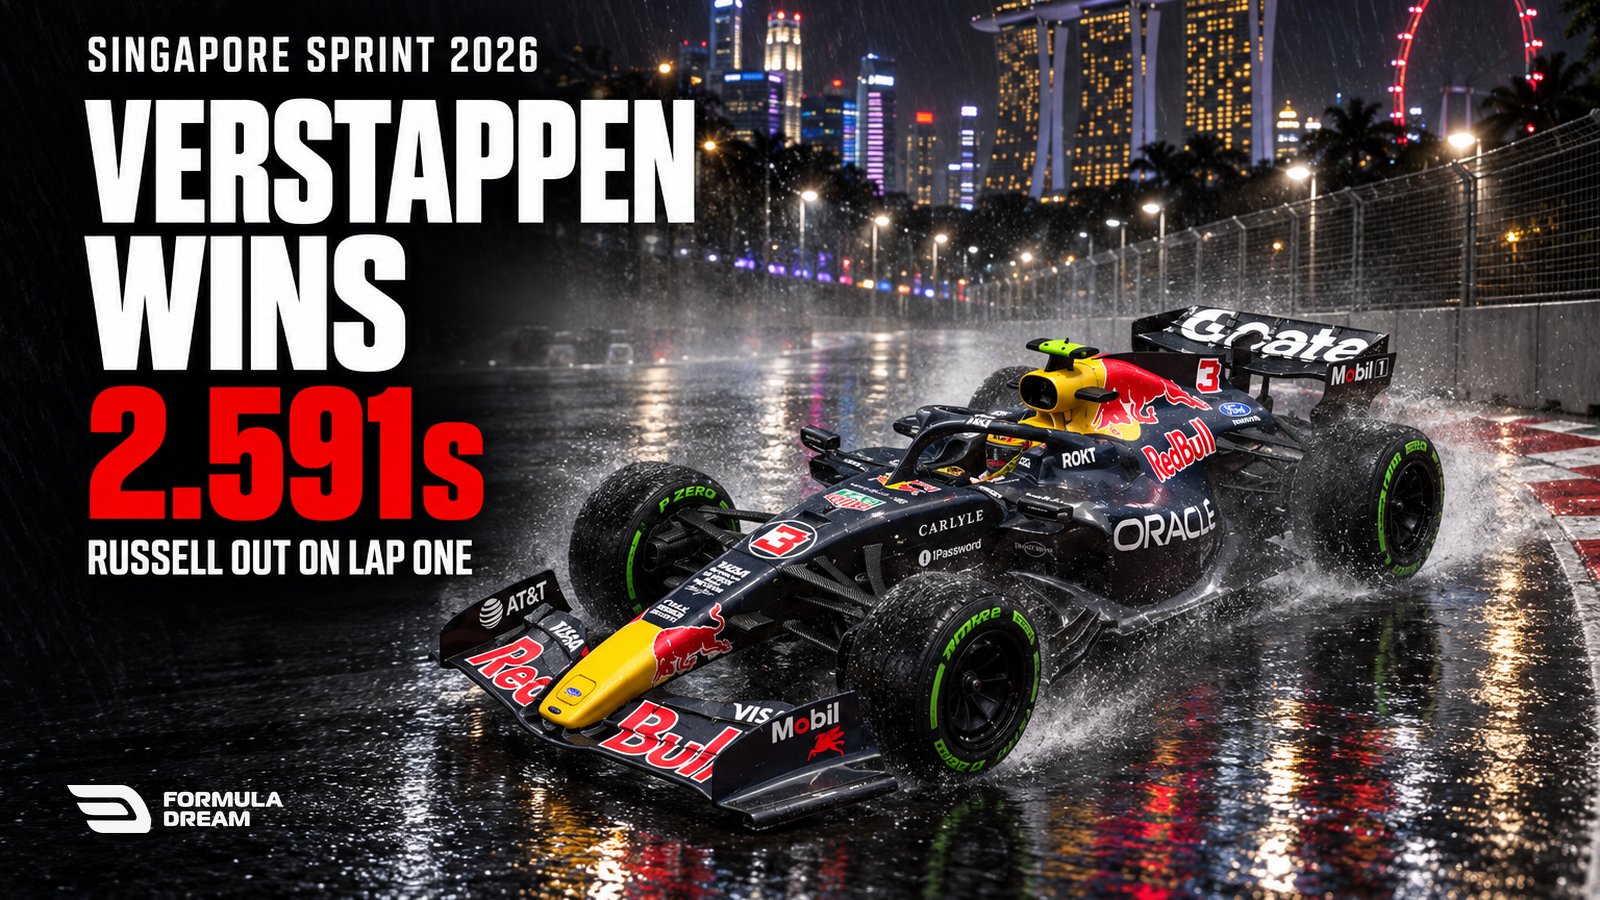
Singapore Sprint 2026 Results: Russell Crashes From the Lead
Russell took the lead at turn one and crashed at the final corner of the same lap. Verstappen won, Hamilton charged to second, and the McLarens hit each other.