For every green racing lap of 2025 we calculated the gap to the car directly ahead on the same lap, using cumulative end-of-lap times. The race leader is excluded on every lap, since there is nobody in front of them. Comparing times on the same lap number means a car a lap down is never counted as being ahead.
No filtering beyond that. Every green lap, every driver, all 24 races. 20,786 classified laps.
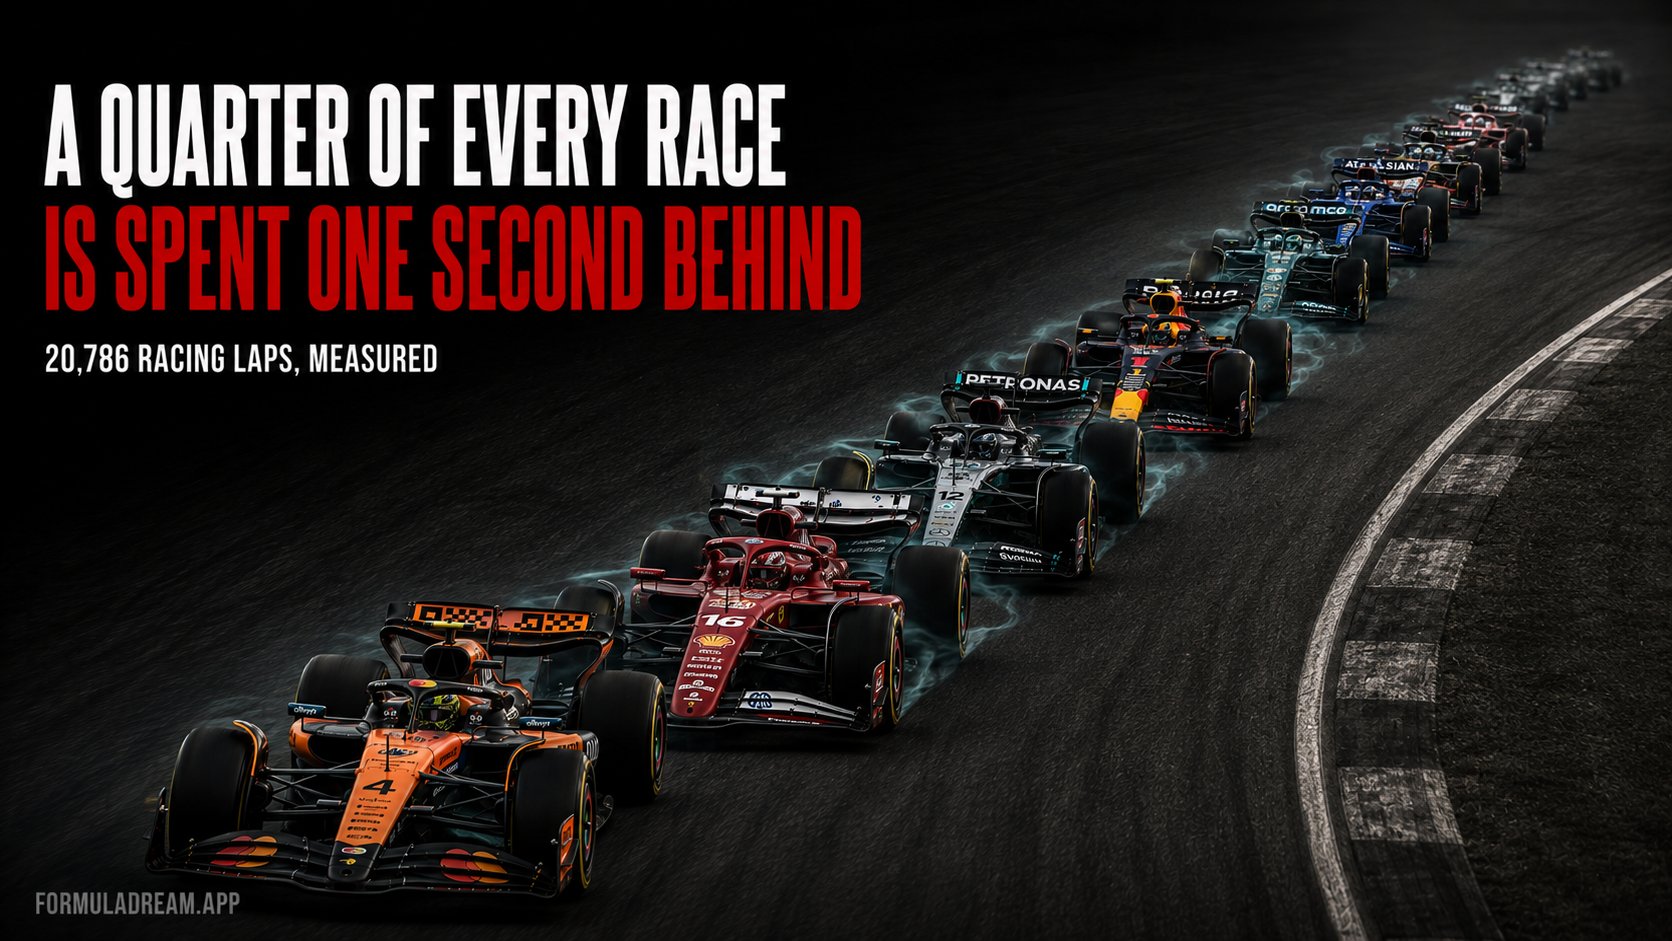
Under 1 second: 25.6%
1 to 2 seconds: 22.4%
2 to 3 seconds: 14.2%
3 to 5 seconds: 14.9%
5 to 10 seconds: 14.0%
Over 10 seconds: 8.9%
A note on reading that chart. The bands are not equal widths, so the raw shares are misleading. Per second of gap the density falls away cleanly: 25.6% per second in the first band, then 22.4, then 14.2, then 7.5, then 2.8. The field is heavily concentrated close together and thins out steadily. We flag it because the "3 to 5s" band looks like an increase and is not.
The picture this paints of a Grand Prix
The romantic version of Formula 1 is a driver alone against the circuit, extracting a perfect lap. The measured version is different.
Nearly half of all racing laps are run within two seconds of another car. Fewer than one lap in ten is run in genuinely open track.
This is why so much of what we have measured elsewhere matters so much. Dirty air costs about half a second a lap within one second. Overtaking is rare, at 0.44 passes per lap across a season. Put those together with this distribution and the shape of a modern Grand Prix is clear: drivers spend most of the race close enough to be hurt by the car ahead and not close enough to pass it.
At Zandvoort, 40% of laps are in traffic
Share of green racing laps run within a second of the car ahead, by circuit
Zandvoort: 40.2%
Monaco: 34.3%
Imola: 33.6%
Monza: 31.7%
Spa: 31.1%
Bahrain: 30.8%
Hungaroring: 28.3%
Silverstone: 23.5%
Shanghai: 17.9%
Melbourne: 17.4%
Austin: 15.4%
Zandvoort tops it and Monaco is second, which fits: both are short laps where the field naturally compresses, and neither offers a realistic way past.
Monza at 31.7% is the interesting one. It has the fastest lap on the calendar and the longest straights, and cars still spend nearly a third of the race within a second of each other. That is the slipstream working exactly as advertised, cars towing each other along in packs, and it lines up with our finding that following at Monza costs almost nothing.
At the other end, Austin, Melbourne and Shanghai spread the field out most, all under 18%.
What traffic costs
Multiply how often the field runs at each distance by what that distance costs, and traffic stops being an abstraction.
How much each traffic band contributes to the average lap time across the field
Within 1s: 25.6% of laps, costing 0.49s each, contributing 0.125s
1 to 2s: 22.4% of laps, costing 0.29s each, contributing 0.065s
2 to 3s: 14.2% of laps, costing 0.05s each, contributing 0.007s
Beyond 3s: 37.8% of laps, no measurable penalty
Total: about 0.197 seconds a lap, averaged across every car on the grid.
Over a 57 lap Grand Prix that is roughly 11 seconds per driver, lost to nothing but the presence of other cars. Not to strategy, not to mistakes, not to the car being slow. Simply to running behind someone.
When a driver says they were "stuck in traffic all race", believe them. A quarter of racing laps are spent within a second of another car, and each of those costs half a second.
Clear air is genuinely rare and genuinely valuable. Fewer than one lap in ten is run with more than ten seconds of space.
A short circuit means a compressed field. Zandvoort and Monaco top this list because the lap is short, not because the racing is close in a good way.
This is the hidden cost the leader never pays, and it compounds across a race distance into something worth more than a pit stop.
Method
Data: FastF1, all 24 races of the 2025 season. 20,786 classified green racing laps.
Gap to the car directly ahead computed from cumulative end-of-lap session times, compared within the same lap number so lapped cars cannot register as being ahead.
The race leader is excluded on every lap, having no car in front.
Excluded: any lap not under green flag, in-laps, out-laps, deleted laps, and laps 1 and 2.
Band widths are unequal, so raw shares should be read alongside the per-second densities given in the body. This is a presentation hazard rather than a data problem.
The lap time costs per band come from our own dirty air measurement of the same season, which used a clear-air baseline per driver-stint.
The 0.197s figure is a weighted average across the whole field, including cars that spend most of the race alone. An individual driver stuck behind a rival for a full stint loses far more.
The 11 second figure assumes a 57 lap race, which is close to the 2025 median. Longer races lose more.
A quarter of every race is spent within a second of another car. That number is visible live, as an interval that stops falling.
The Formula Dream app runs a live Dashboard through every session: every car moving on the circuit map, and a timing tower with lap times, gaps and intervals, tyre compound and age, pit counts and positions gained or lost. It is the same information these measurements come from, arriving live. You also get live driver radio as it is broadcast, and every FIA document of the weekend as it is published.
Free, no subscription, no ads, independent. Not affiliated with Formula 1.
Singapore Sprint 2026 Results: Russell Crashes From the Lead
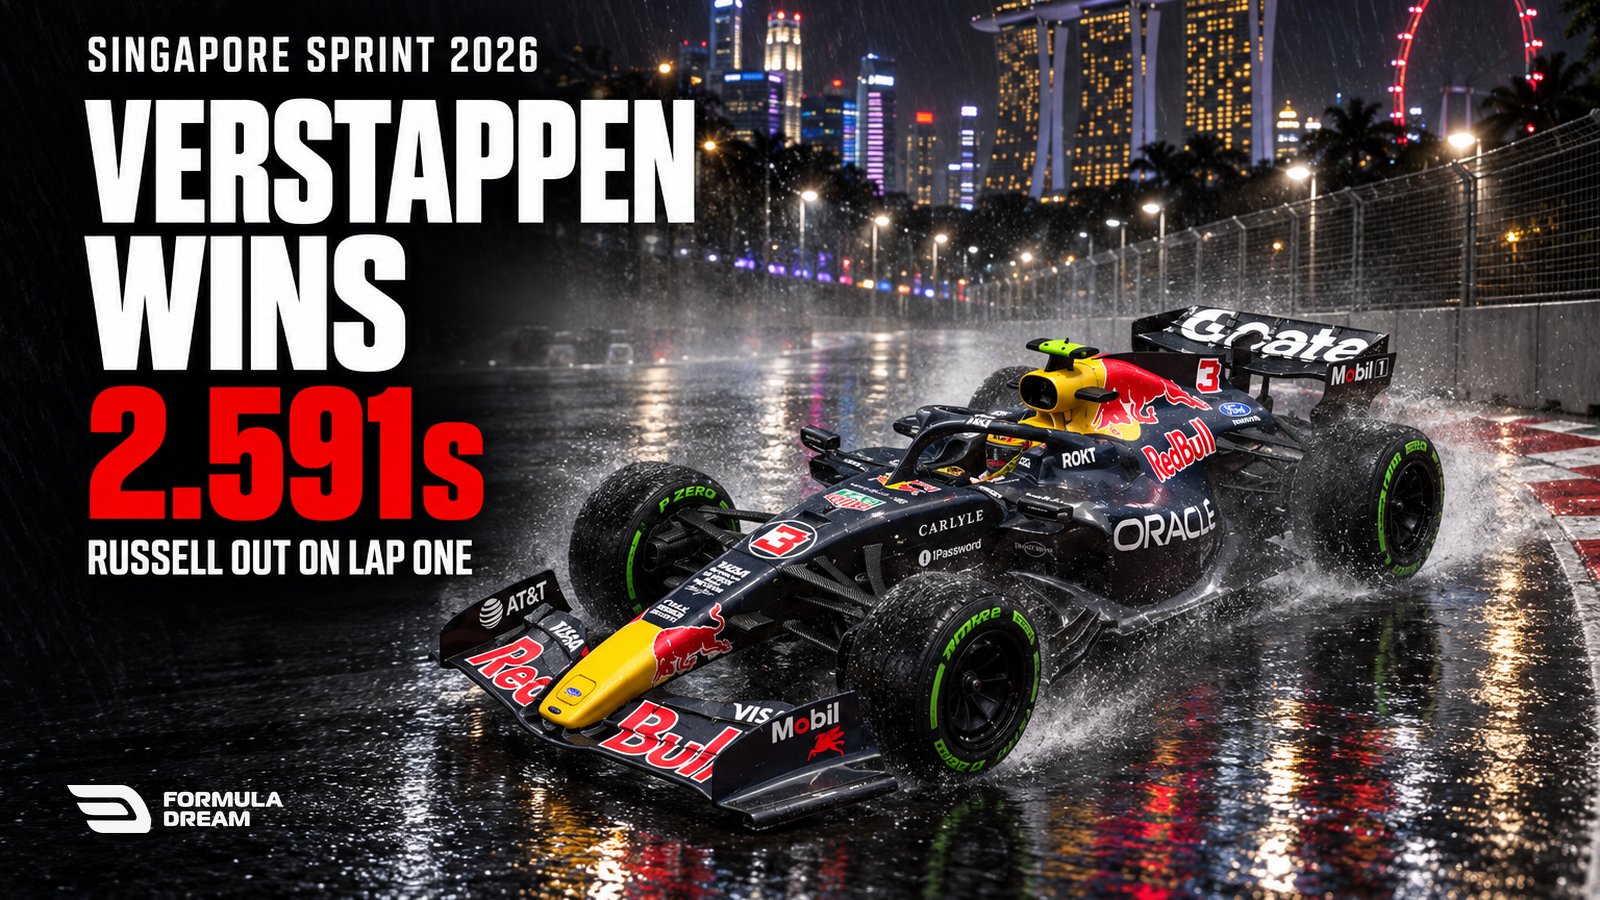
Russell took the lead at turn one and crashed at the final corner of the same lap. Verstappen won, Hamilton charged to second, and the McLarens hit each other.