Every 2026 F1 Car in 3D | Explore the Grid | FormulaDream
Guides
See Every 2026 F1 Car in 3D: The New-Rules Grid, Up Close
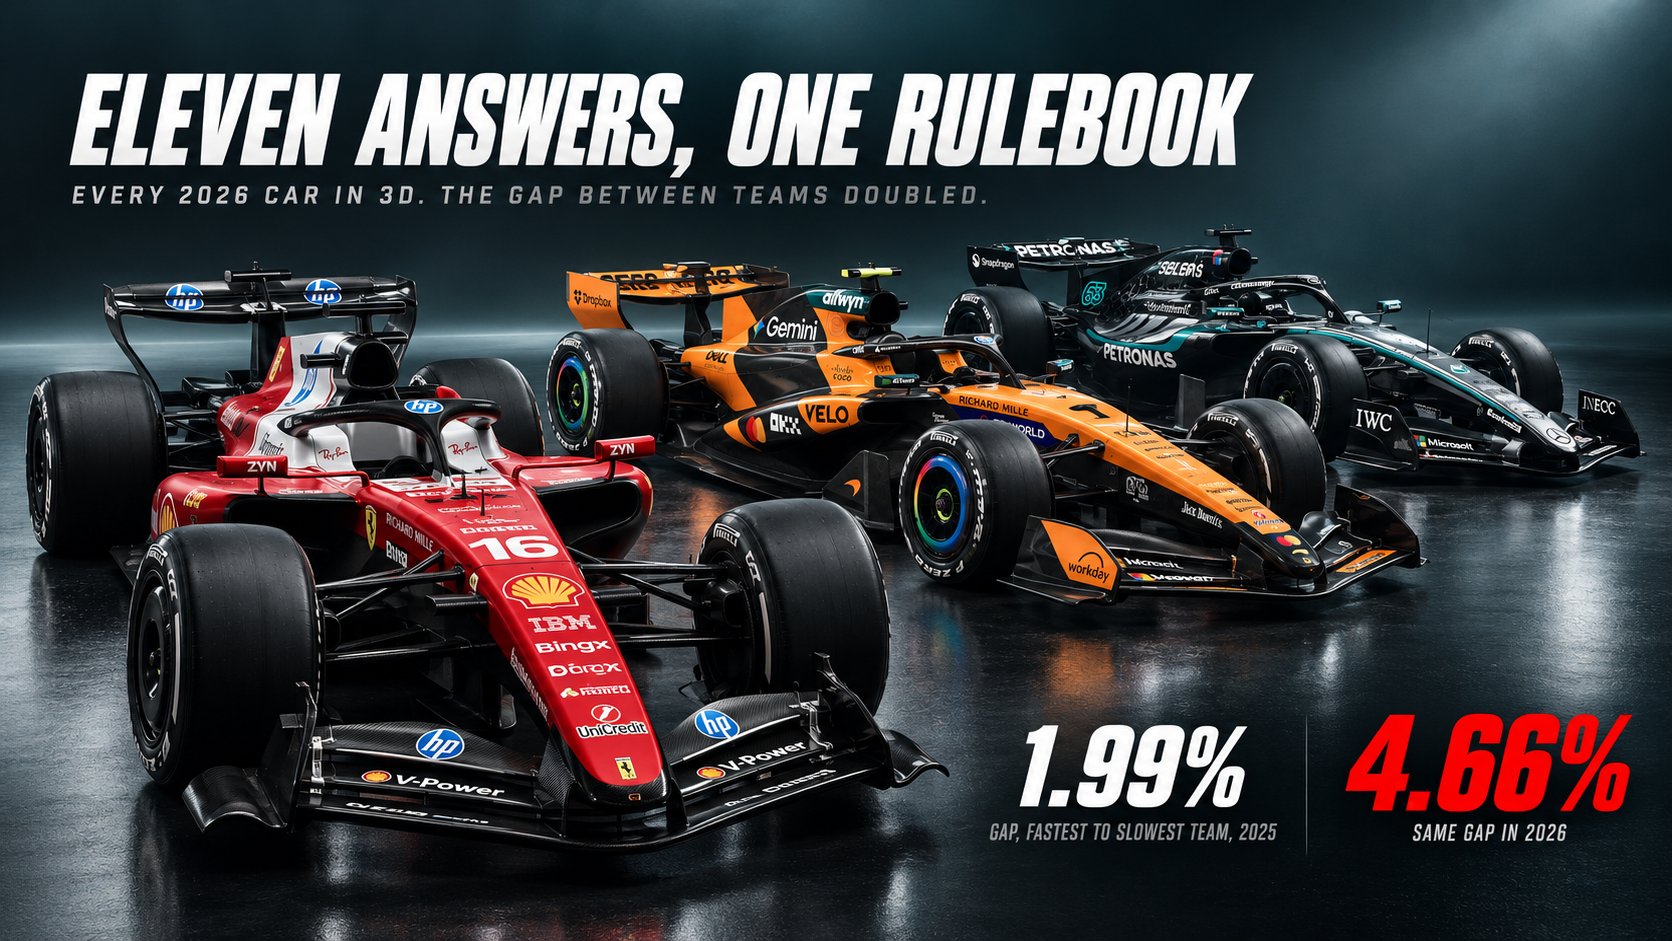
2026 is the biggest rules reset in years, and we can prove the teams disagreed: the gap between the fastest and slowest team more than doubled. Spin every car in 3D.
You almost never get to just look at a Formula 1 car. You get it mid-corner on a broadcast, or in a handful of press-shot angles a team decides to release, and that is it. You rarely get to walk around one, turn it over, and compare it against the car parked next to it on the grid.
That is a shame in any year. In 2026 it is a bigger one, because this is the season the cars changed, and because the teams did not all change them the same way.
The teams disagreed, and it shows up in the timing data
The usual claim about a new rulebook is that teams "arrive at different answers". That is easy to say about shapes and hard to prove. So we measured it.
We took the fastest legal qualifying lap from every team at each 2026 round, excluding deleted laps, and compared the spread between the quickest team and the slowest with the same measurement from 2025. We dropped any circuit that was wet in either year, which left ten.
Grand Prix
2026 pole
2025 pole
2026 slower by
Gap, fastest to slowest team, 2026
2025
Melbourne
1:18.518
1:15.096
4.56%
5.21%
2.73%
Silverstone
1:28.111
1:24.892
3.79%
5.39%
1.83%
Zandvoort
1:11.163
1:08.662
3.64%
4.51%
2.24%
Spielberg
1:06.113
1:03.971
3.35%
5.79%
1.95%
Budapest
1:17.207
1:14.890
3.09%
4.77%
1.32%
Monaco
1:12.051
1:09.954
3.00%
4.58%
2.92%
Montreal
1:12.578
1:10.899
2.37%
3.93%
1.99%
Suzuka
1:28.778
1:26.983
2.06%
4.36%
1.82%
Miami
1:27.798
1:26.204
1.85%
4.36%
1.62%
Shanghai
1:32.064
1:30.641
1.57%
3.66%
1.49%
Fastest legal qualifying lap per circuit, 2026 against 2025. Wet sessions excluded. From F1 timing data.
Two results, and both are unanimous across all ten circuits.
The 2026 cars are slower. Poles are 2.93% off the 2025 times on average, a median of 3.05%. Not one circuit bucked it. On a 90 second lap that is most of three seconds. We go into why in are F1 cars getting faster.
And the field pulled apart. The gap between the quickest and slowest team more than doubled, from 1.99% in 2025 to 4.66% in 2026. Again, every single circuit moved the same way.
There is an obvious objection to that, and it deserves checking rather than hand-waving: 2026 added an eleventh team, and a brand new entry is usually slow, so of course the spread grew.
We tested it. Drop the slowest team from every 2026 session entirely and compare only the remaining ten with 2025's ten. The spread is still 3.85%, against 1.99%. The gap has roughly doubled even with the new entry removed from the maths. It is also not simply a Cadillac story: across the ten circuits the slowest team was Cadillac six times and Aston Martin four.
That second number is the one worth sitting with while you look at the cars. In 2025 the entire grid was covered by about two percent of lap time, which is convergence: everyone had found roughly the same answer to a rulebook that had been stable for years. In 2026 that doubled. Eleven teams read one new set of regulations and produced cars that are genuinely, measurably further apart in performance than at any point in the previous era.
So when the shapes look different in the Showroom, that is not an illusion. The differences you can see are the same differences the stopwatch is recording.
Why 2026 is worth a proper look
New power-unit rules and new chassis and aerodynamic regulations arrived together, which means every team started this generation from a much cleaner sheet than usual. When the rulebook changes this much at once, the interpretations spread out.
That is exactly when it gets interesting to look closely. In a stable era the cars converge and start to look like copies of each other, which is what the 1.99% figure from 2025 describes. In the first year of a new formula they do not. The shapes, the packaging, the way each team has laid out its bodywork, all of it carries a design choice you can see, if you can get a clear look at the whole car. The regulations themselves are broken down in the 2026 F1 regulations explained.
What you can do in the Showroom
The 3D Showroom is built for exactly that look. Every car on the 2026 grid is in there as a model you can handle, not a photo you have to squint at:
Spin it. Rotate any car a full 360 degrees and stop at whatever angle you want, including the ones teams never publish.
Get close. Zoom in on the front wing, the sidepod, the engine cover, the rear.
Go down the grid. Step from one team to the next and see the whole field, from the front-runners to the newest name on the grid.
It is the difference between being shown a car and being handed one.
See it
Here is the Ferrari, to start with. Drag to rotate it, scroll to zoom, and take your time.
You do not need to be an aerodynamicist to get something out of this. A few things reward a slow look:
The nose and front wing. This is where teams disagree most visibly, and it is the first thing your eye can compare car to car.
The sidepods and how the bodywork wraps. How tightly a car is packaged tells you a lot about how a team has chosen to cool and shape its airflow.
The overall silhouette. Line two cars up in your head and the family resemblance of the 2026 rules shows through, but so do the choices each team made inside them.
The liveries. New-era cars often come with refreshed colours, and seeing them in 3D under even light, rather than in a launch render, is the fairest way to judge them.
The thing you cannot see: they are all fast in a straight line
One warning about reading too much into the shapes.
Whatever the bodywork differences, straight-line speed is where this grid has converged, not diverged. The highest speed trap reading of 2026 belongs to Esteban Ocon at Barcelona, 358 km/h, in an Alpine rather than a front-runner. At Monza the top twelve cars through the speed trap were covered by just 9 km/h.
So the 4.66% spread is not being produced on the straights. It is being produced in the corners, which is exactly where the aerodynamic choices you are looking at do their work. The full speed breakdown is in how fast are F1 cars.
Explore the whole grid
Open the 3D Showroom and work your way down the field, one car at a time. When you are done looking at the cars, you can see how they stack up on track in Track Domination, which colours a qualifying lap by who was fastest through each corner, or watch qualifying gaps drawn to scale as real distance in the Gap Visualizer.
See the 2026 cars race
Looking at the cars is one thing. Following them through a session is another.
The Formula Dream app runs a live Dashboard through every session: every car moving on the circuit map, and a timing tower with lap times, gaps and intervals, tyre compound and age, pit counts and positions, plus flag and safety car alerts the moment race control calls them. In a season where the teams are this far apart, the useful column is sector times, because that is where you see which car is finding its advantage in the corners rather than on the straights. You also get live driver radio as it is broadcast, and every FIA document of the weekend collected as it is published, which is where the stewards' decisions that change results actually appear.
Free, no subscription, no ads, independent. Not affiliated with Formula 1.
Two of these cars have their own breakdowns: the championship-leading Mercedes W17 and the Ferrari SF-26.
Frequently asked questions
How many cars are on the 2026 F1 grid?
Eleven teams, following the addition of a new entry for this season, which is the first change to the number of constructors in years.
Are the 2026 F1 cars slower than the 2025 cars?
Yes. We measured the fastest legal qualifying lap at ten circuits raced dry in both seasons, and 2026 poles were 2.93% slower on average, with a median of 3.05%. Every one of the ten circuits was slower.
Why do the 2026 F1 cars look so different from each other?
Because the regulations changed enough that teams could interpret them in genuinely different ways, and the timing data agrees with what your eyes see. The gap between the fastest and slowest team in qualifying went from 1.99% in 2025 to 4.66% in 2026, and it is still 3.85% if you exclude the new eleventh team entirely.
Which 2026 F1 car is the fastest in a straight line?
Straight-line speed is close across the grid. The highest 2026 speed trap reading we measured is 358 km/h by Esteban Ocon at Barcelona in an Alpine, and at Monza the top twelve cars were covered by 9 km/h.
Can I see the 2026 F1 cars in 3D for free?
Yes. The FormulaDream 3D Showroom lets you rotate, zoom and compare every car on the 2026 grid in a browser, with no account needed.
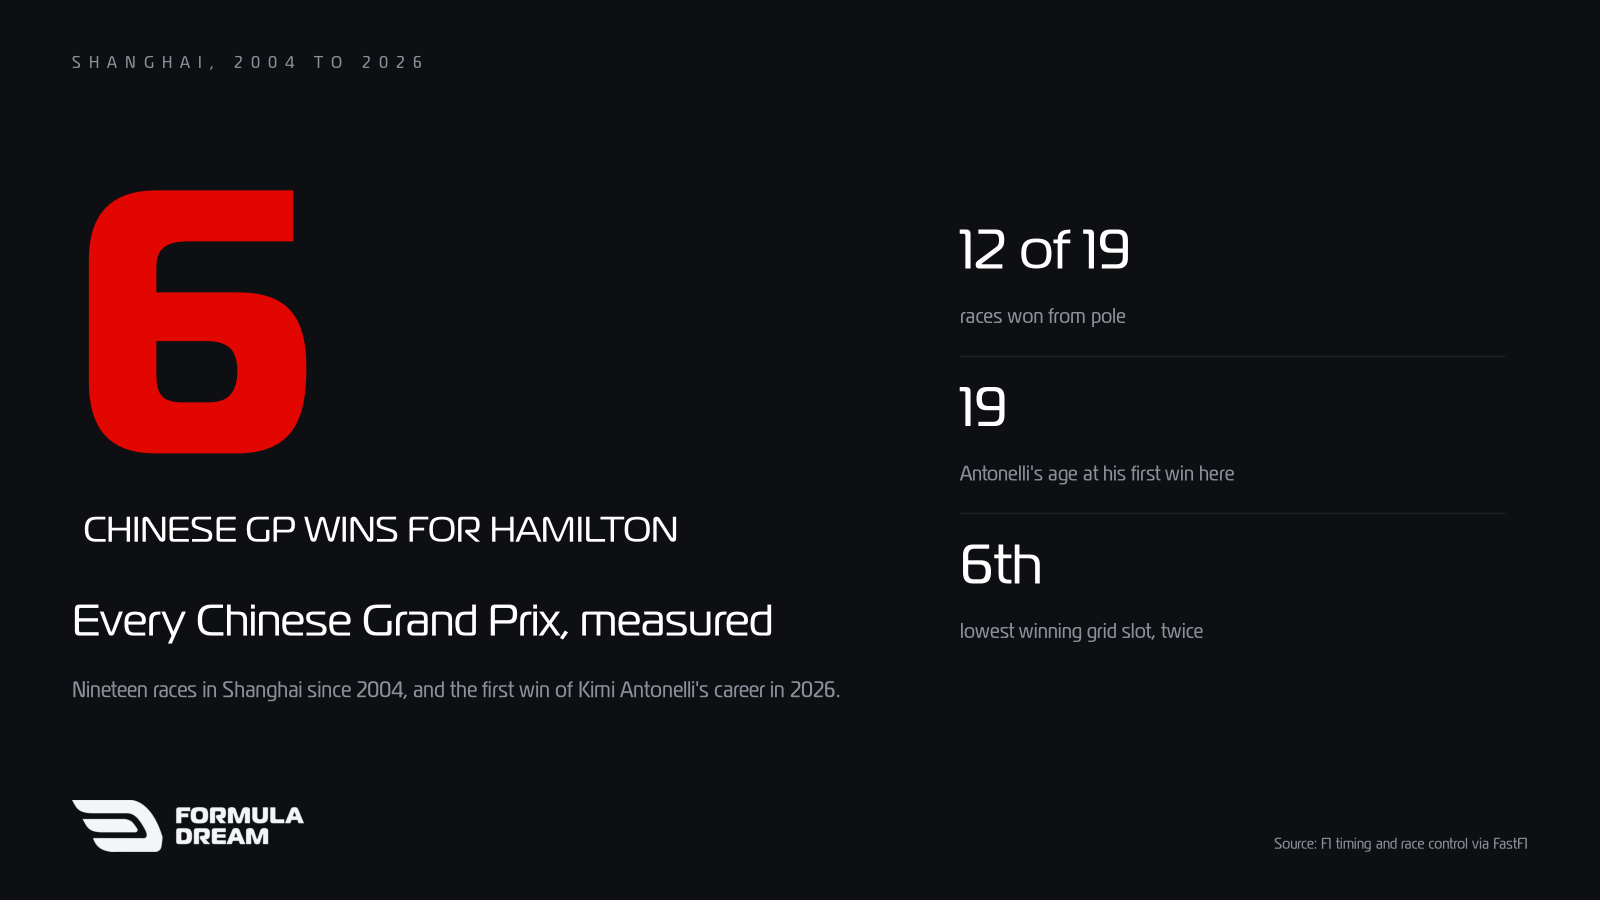
Nineteen Chinese Grands Prix have been held in Shanghai since 2004. Lewis Hamilton won six, pole won twelve, and in 2026 Kimi Antonelli took the first win of his career there, at 19, with Hamilton on the podium for Ferrari for the first time. Every winner, grid slot and safety car, measured.