Every Formula 1 car broadcasts a stream of data as it laps: how fast it is going, how much throttle the driver is holding, whether the brake is on, which gear, what the engine is doing. That stream is telemetry, and once you can read it a lap stops being a time and becomes a description.
We work from it constantly, so this is a guide to what the channels actually say, written from real 2026 laps rather than in the abstract.
The channels, and what each one is good for
A usable telemetry trace has five channels. They are simple individually and only become interesting together.
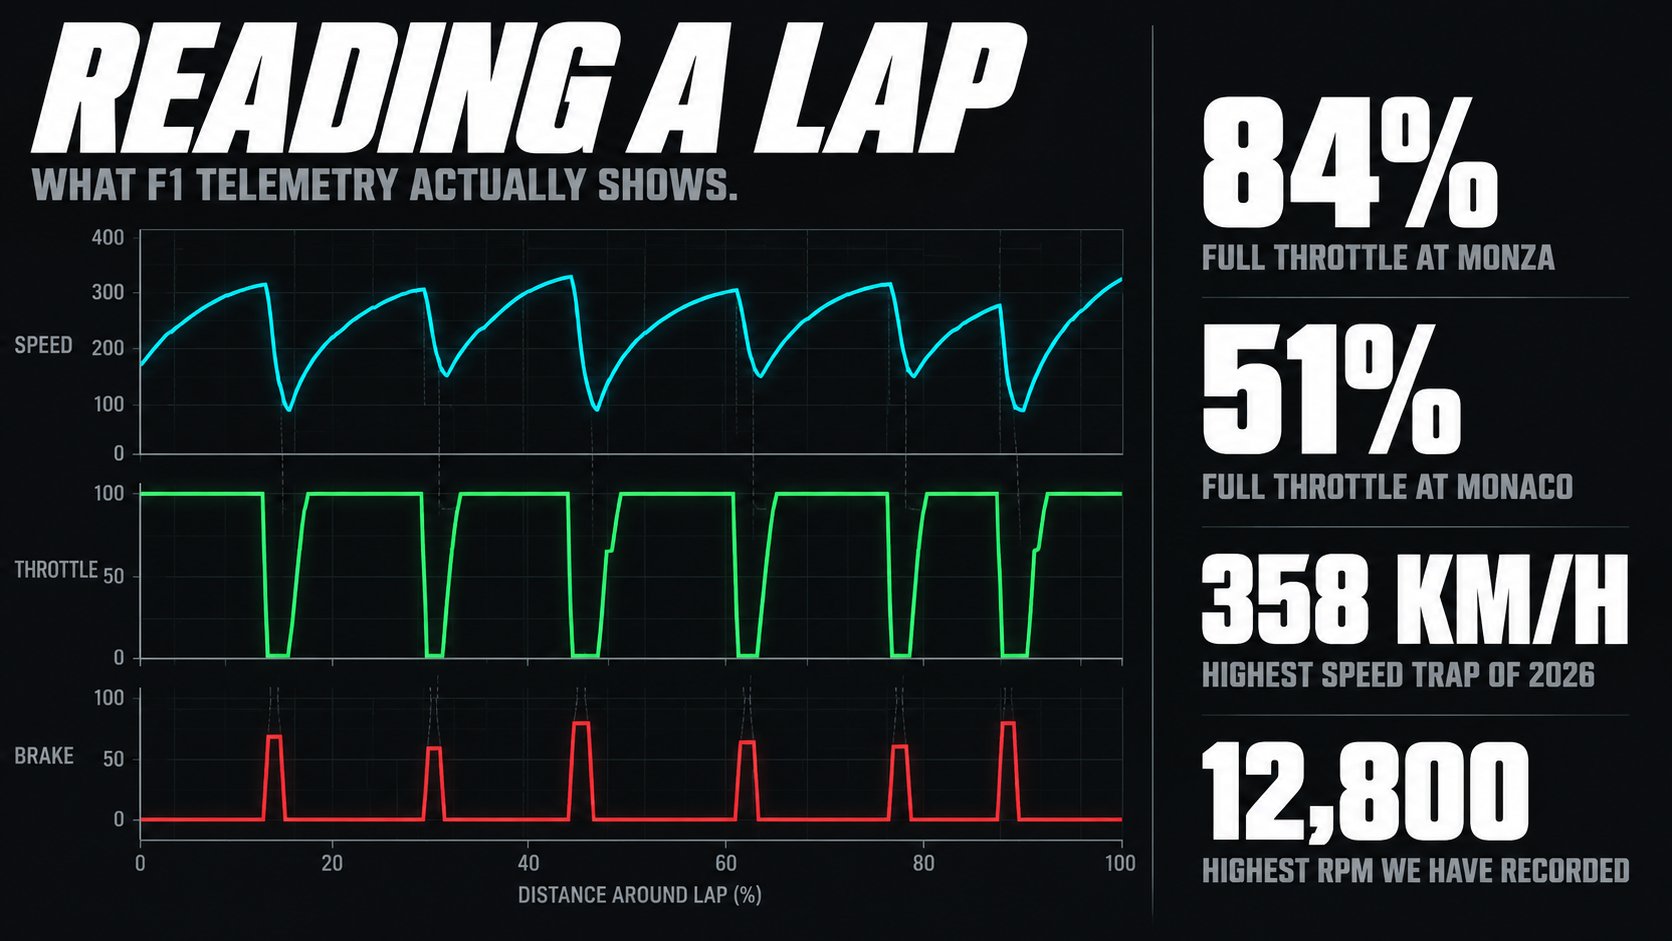
Speed. The headline channel, in km/h, sampled continuously around the lap. It gives you peak speed, minimum speed, and the shape of every corner. The highest speed trap reading we measured in 2026 is 358 km/h, by Esteban Ocon at Barcelona.
Throttle. A percentage, 0 to 100. The number worth extracting is the share of the lap held at or near 100%, because that single figure separates circuits more cleanly than anything else. At Monza the 2026 pole lap was at full throttle for 84% of its distance. At Monaco it was 51%.
Brake. Usually on or off rather than a pressure reading, which is less useful than it sounds but still tells you how many times a driver has to stop the car. Monza and Spa need six braking events a lap. Monaco, Singapore and the Circuit of the Americas need ten.
Gear and RPM. Gear tells you how a driver is using the corner. RPM tells you how hard the power unit is working, and it is usually less dramatic than people expect: the 2026 regulations permit 15,000 rpm, and across a full season of laps we have never recorded a race lap above roughly 12,800.
DRS. This channel still exists in the data and, since 2026, it reads zero all race, because the system was removed. We confirmed that from the car data itself in what is DRS in F1.
What a lap looks like when you read it
Take the two extremes of the 2026 season and put their numbers side by side. Same regulations, same cars, same month of the year.
Monza
Monaco
Average lap speed
257.2 km/h
163.0 km/h
Full throttle
84%
51%
Braking events
6
10
Longest flat-out run
1,248 m
522 m
Racing line distance
5.842 km
3.337 km
Average lap speed
Monza257.2 km/h
Monaco163.0 km/h
Full throttle
Monza84%
Monaco51%
Braking events
Monza6
Monaco10
Longest flat-out run
Monza1,248 m
Monaco522 m
Racing line distance
Monza5.842 km
Monaco3.337 km
2026 pole laps at the fastest and slowest circuits of the season, measured from car telemetry.
Those two laps are the same sport. The Monza driver is holding the throttle open for five of every six metres. The Monaco driver is off it for half the lap and stopping the car ten times instead of six.
No lap time can tell you that. Monaco's pole was a 1:12.051 and Silverstone's was a 1:28.111, so on the clock Monaco looks like the quicker lap. The telemetry is what stops you drawing the wrong conclusion.
Four traps that make most telemetry comparisons wrong
This is the part worth taking seriously, because every one of these has caught us at least once.
Telemetry is sampled in time, not distance
The car reports at a fixed rate, so slow parts of the lap produce more samples per metre than fast parts. If you calculate full-throttle percentage by counting samples, you over-weight the slow corners and understate the figure, sometimes badly.
Full-throttle share has to be computed by distance. Sum the metres covered with the throttle open, divide by the length of the lap.
We can put a size on the error because we made it ourselves. Measured both ways across all thirteen 2026 qualifying sessions, counting samples understates the figure by 5 to 14 percentage points, and the gap is widest at the circuits with the slowest corners: Monaco reads 37% by samples and 51% by distance, Miami 54% against 68%. Our own circuit table carried one row on each convention until this week.
Deleted laps are still in the data
A lap that the stewards delete for track limits does not vanish from the timing feed. It sits there looking like a valid lap, and it is often the fastest one, because leaving the track is quick.
At Monza final practice this year the stewards deleted 21 lap times in one hour, sixteen of them for track limits and ten of those at a single corner. Any analysis that had not filtered them would have reported the wrong order for the session.
A wet session looks like a slow circuit
If a circuit reports a strangely low speed one year, check the tyres before you believe it. Qualifying for the 2025 Las Vegas Grand Prix produced an average lap speed of 204.9 km/h, which would have made it one of the slowest circuits on the calendar. Of the 375 laps run in that session, 282 were on full wets and 93 on intermediates, with no slick running at all. The circuit's real figure is 239.4 km/h.
The same trap caught Interlagos in 2024 and Spa in 2024. An outlier year is a wet year until proven otherwise, and once you notice it, a wet and dry pair from the same driver at the same circuit becomes a good measurement in its own right. We used exactly that at Interlagos, where rain cost Lando Norris 13.894 seconds a lap.
Cars from different years are not comparable
Regulations change the cars. The 2026 machines are 2.93% slower than the 2025 generation across ten circuits raced dry in both seasons, so quoting a 2024 lap against a 2026 lap silently flatters the older one.
Las Vegas is the clean example. Its 239.4 km/h from 2024 looks quicker than Melbourne's 238.1 from 2026, but on the same 2024 cars Melbourne ran 247.4. Melbourne is genuinely the faster circuit. When a circuit has not been raced in the current season, rank it against other circuits from its own year.
What telemetry cannot tell you
Two honest limits, because the data is often asked to carry more than it can.
Fuel load is not published. A car carrying a race fuel load is several seconds a lap slower than the same car on low fuel, and nothing in the public data tells you which you are looking at. This is why practice lap times are close to meaningless as a measure of car performance, and why we say so in every session report.
Tyre age is visible, tyre condition is not. You can see how many laps a set has done. You cannot see how much of it is left.
Where to see it yourself
You do not need to write code to look at this.
Our Gap Visualizer converts qualifying time gaps into real metres of track, which is the same idea applied to the timing feed rather than the car feed. Track Domination colours a lap by which driver was fastest through each segment, which is telemetry comparison drawn onto the circuit rather than a chart.
For the numbers behind this article, the full 2026 ranking is in the fastest F1 circuits, and every pole lap of the season with its measured average speed is in F1 pole times 2026.
Watch the data live instead of afterwards
Telemetry read after the session is analysis. Read during it, it is the race.
The Formula Dream app runs a live Dashboard through every session: every car on the circuit map, and a timing tower with lap times, gaps and intervals, tyre compound and age, plus flag and safety car alerts as race control calls them. There is a lap scrubber to rewind inside a session, and a replay download so you can watch a past session back offline with the full timing. You also get live driver radio as it is broadcast, and every FIA document of the weekend as it is published, which is where deleted laps appear before anyone reports them.
Live timing is in active development and labelled beta in the app. Free, no subscription, no ads, independent. Not affiliated with Formula 1.
The stream of data a Formula 1 car sends back as it laps: speed, throttle position, brake, gear, engine RPM and more. Teams use hundreds of channels. The public timing feed carries a smaller set, which is enough to measure how a lap was driven.
What data do F1 teams get from the car?
Far more than is public, including tyre and brake temperatures, suspension loads, fuel flow and full power unit health. The publicly available channels are speed, throttle, brake, gear, RPM and DRS.
How much of an F1 lap is spent at full throttle?
It depends entirely on the circuit. We measured the 2026 Monza pole lap at 84% full throttle and the Monaco pole lap at 51%, both as a share of lap distance. Most circuits fall between 63% and 77%.
Why do F1 cars not use the full rev limit?
The 2026 regulations allow 15,000 rpm, but engines are mapped for efficiency and reliability rather than peak revs, and the gearing rarely puts them there. Across a full season we have not recorded a race lap above roughly 12,800 rpm.
Can you see F1 telemetry live?
Yes, in a limited form. The public timing feed carries speed, sector times, gaps and tyre data during a session, which is what live timing screens and our own app Dashboard are built from. Full team telemetry stays private to the teams.
Why do telemetry comparisons between seasons go wrong?
Because the cars change. The 2026 cars are 2.93% slower than the 2025 generation at circuits raced dry in both years, so a lap from one season compared with a lap from another measures the regulations as much as the circuit or the driver.
Mercedes W17: The 2026 Car, and What It Actually Does
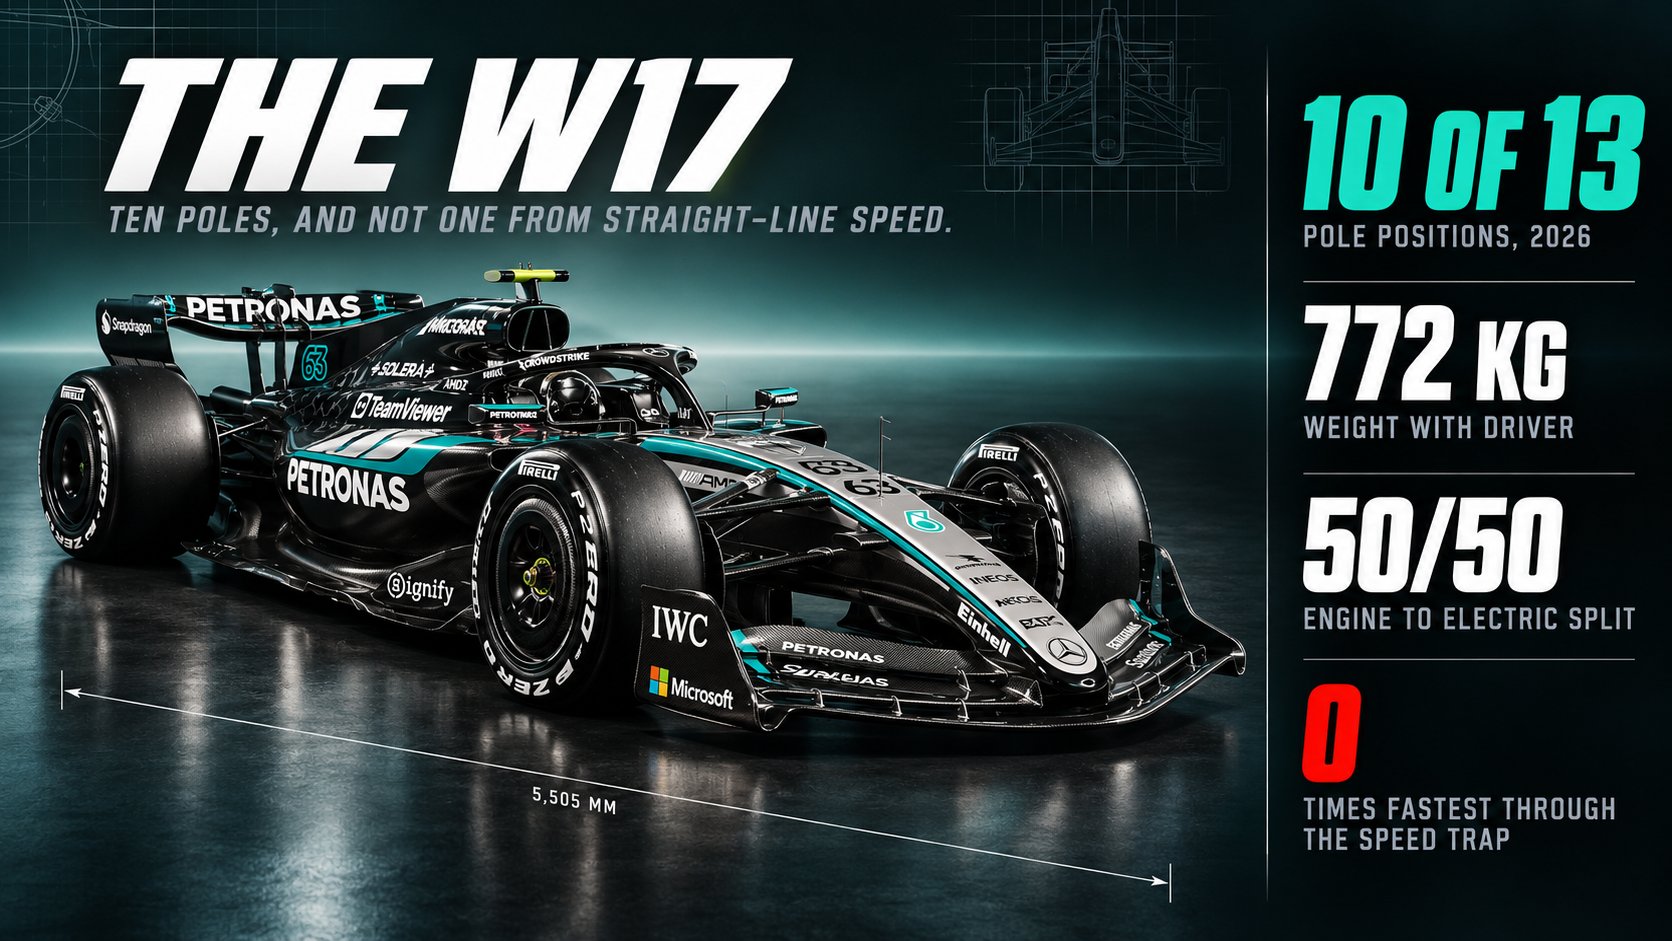
The W17 is smaller, narrower and lighter than the car before it, and it has taken ten of the first thirteen poles. We measured where its advantage actually comes from.